
Turn data into web pages you can share.
Get interactive, presentation-ready insights your team can explore — in minutes, not meetings.
From data source to shareable story.
The story updates in plain English and keeps the visual in sync.
Connect your data
Link a Google Sheet or attach a CSV to create your data Stori.
Shape the story with your agent
Use natural language and custom agent prompts to shape the insight your audience needs.
Share and replay
Generate a link with access controls. Replay with fresh data whenever the source updates.
Connect your data. StoriBot handles the rest.
Start with the tools you already use. More connectors are on the way.
Create Stories from your Google Sheets data. Then replay them on demand when you need to share an update.
Drag and drop files — StoriBot handles parsing and cleanup.
Query warehouse tables directly and turn results into shareable stories.
Get early access →Built around your data
Everything you need, from data source to stakeholder.
Connect, shape, share — all in one platform
Build agents that know your business.Coming Soon
Custom instructions turn StoriBot from a tool into your team's analyst.
Monthly Client Report Agent
"Compare MoM revenue by client tier. Flag any client with >10% churn risk. Use our brand colours."
Sales Pipeline Agent
"Show pipeline by stage and rep. Highlight deals stalled >14 days. Include win-rate trend."
Operations Dashboard Agent
"Summarise fulfilment SLA compliance by warehouse. Break out same-day vs next-day."
Why not just use...
You already have great tools. Here's what StoriBot adds.
FAQ
StoriBot is a data analytics presentation platform. A low effort business intelligence tool for small and medium sized businesses. Connect a Google Sheet or upload a CSV, and StoriBot turns your data into interactive, shareable stories your team can explore — no code, no dashboards, no slide decks.
You can share any Google Sheet with StoriBot to create a Stori. Then use any Google Sheet to replay or update that Stori — StoriBot will pull the latest data and update the graphics and insights. If your team uses Google Sheets for data, StoriBot adds a business intelligence layer on top of it.
StoriBot is designed for teams and individuals who want to gain insights from their data quickly and effectively. It is suitable for data analysts, business professionals, and anyone looking to make data-driven decisions. It's particularly powerful if you need a way to share data visualisations with stakeholders and have a way for them to ask questions and explore the data on their own without needing to host this for them.
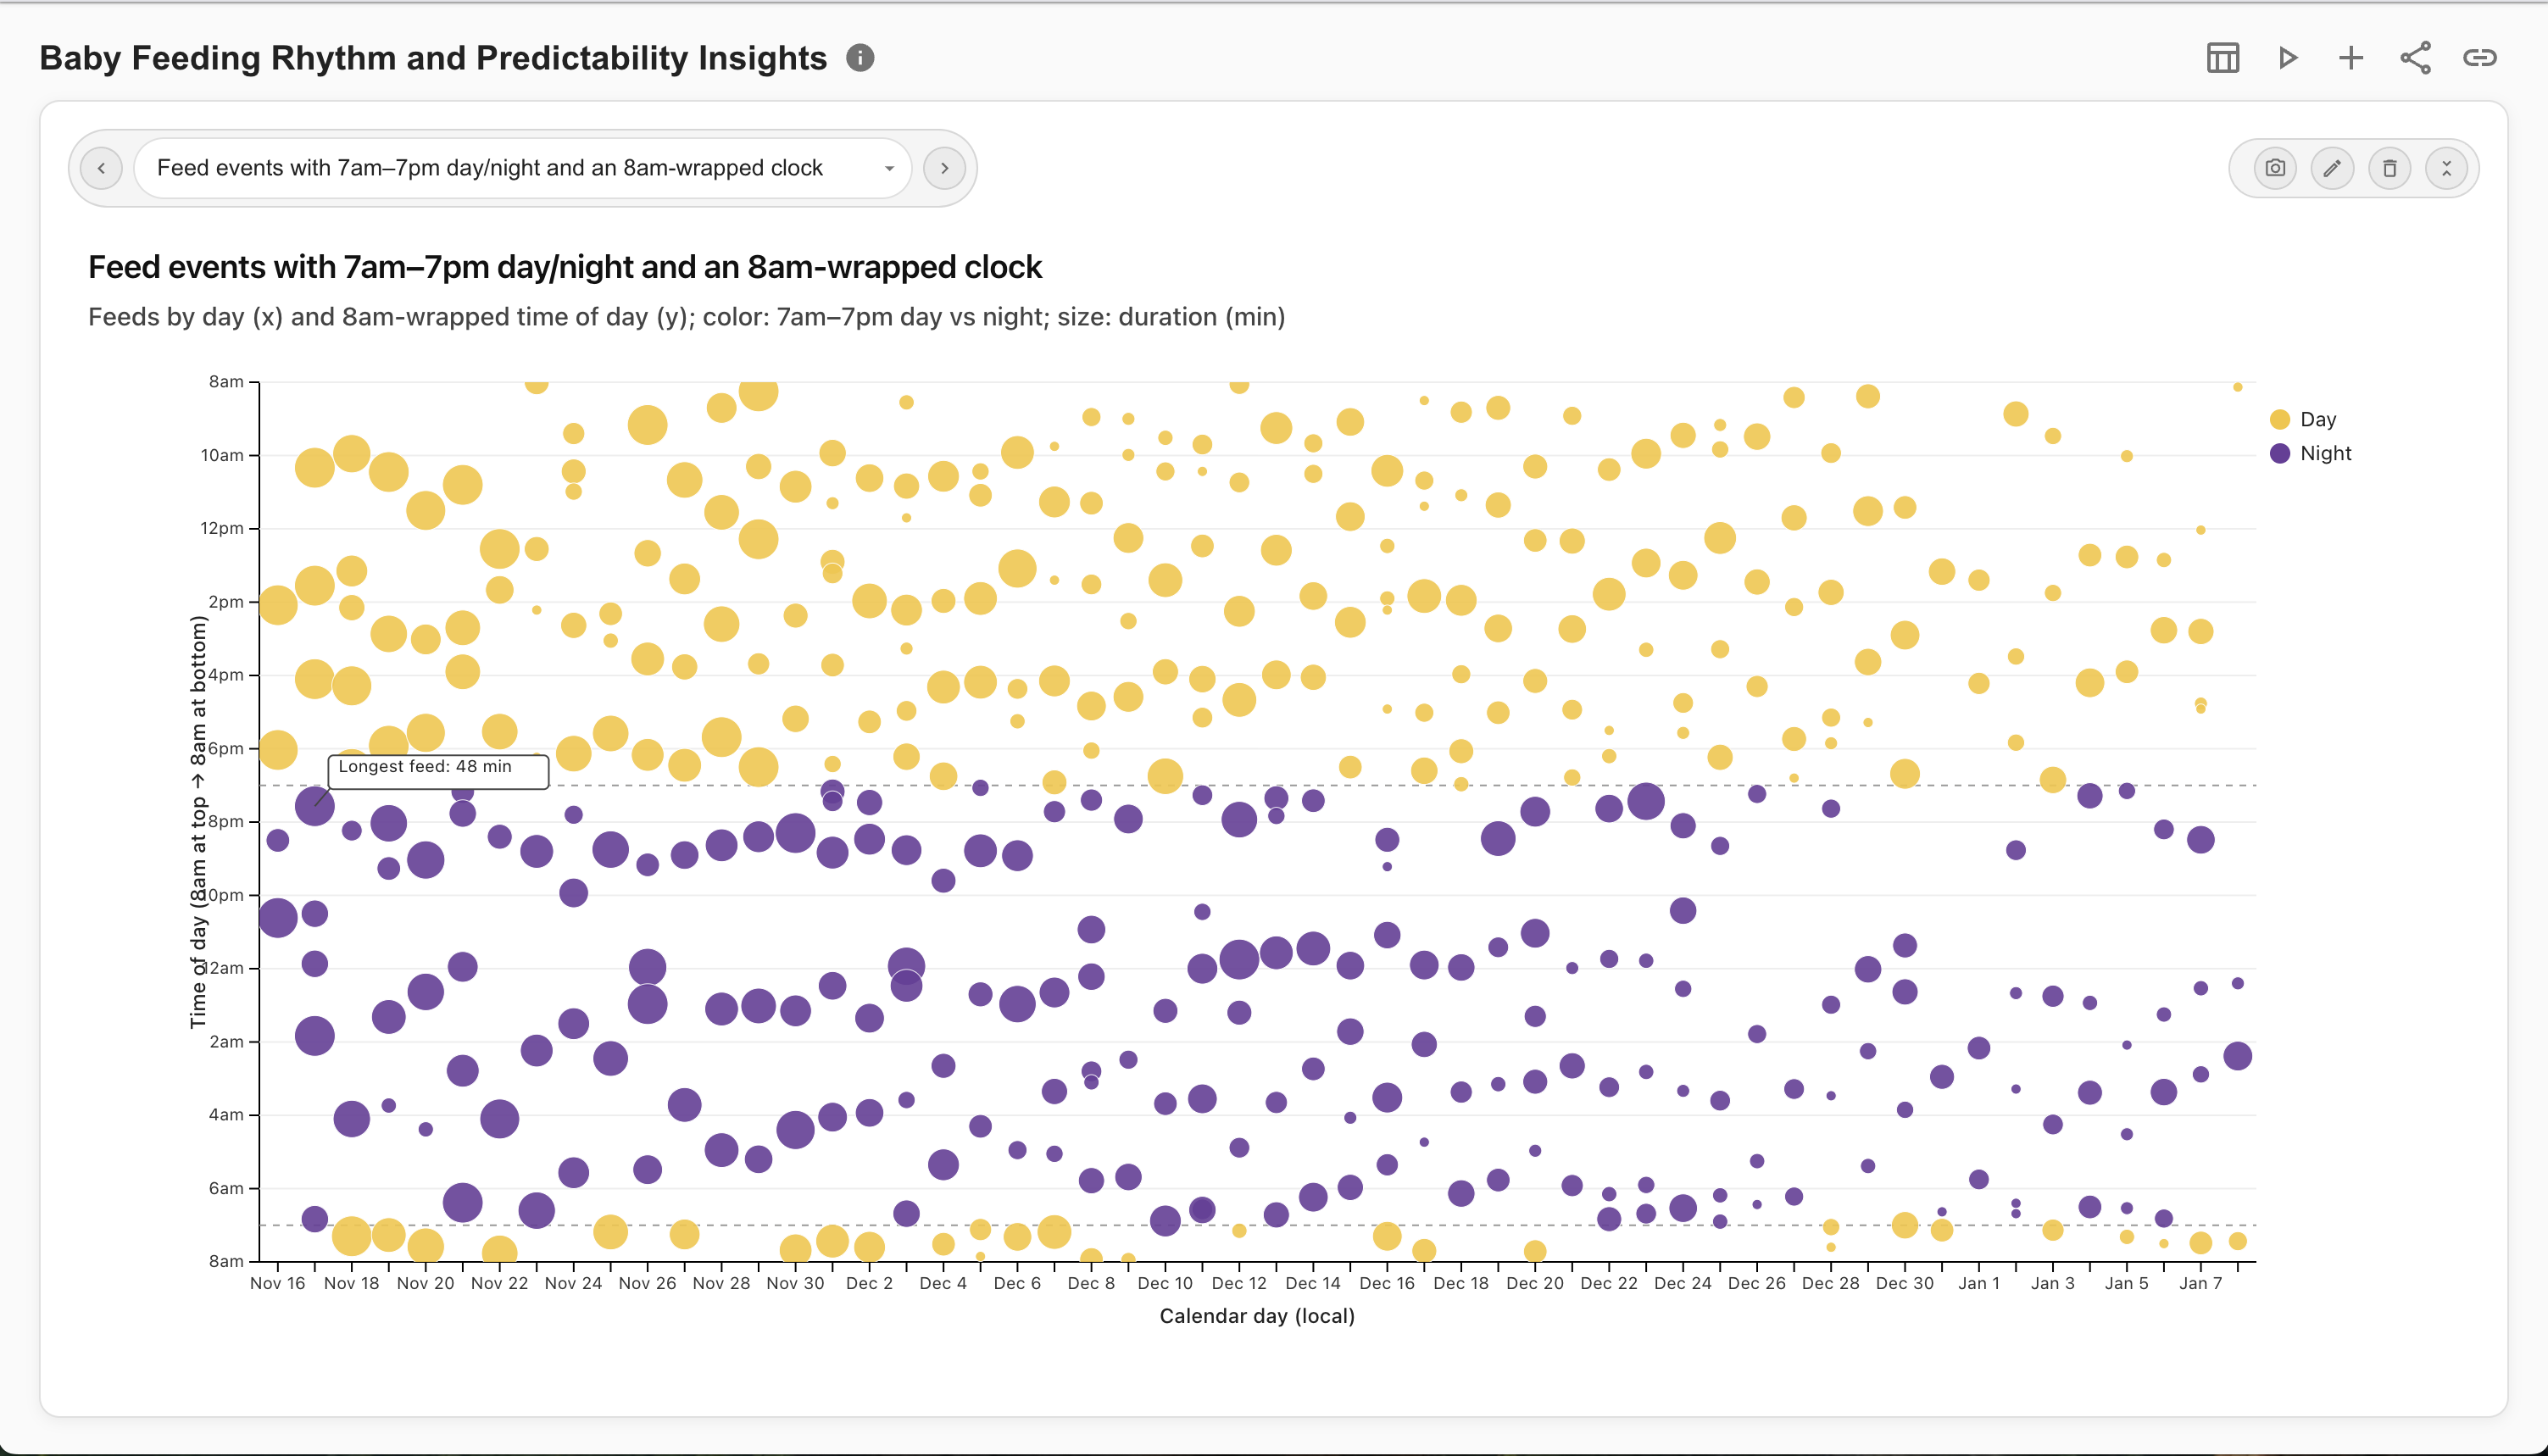
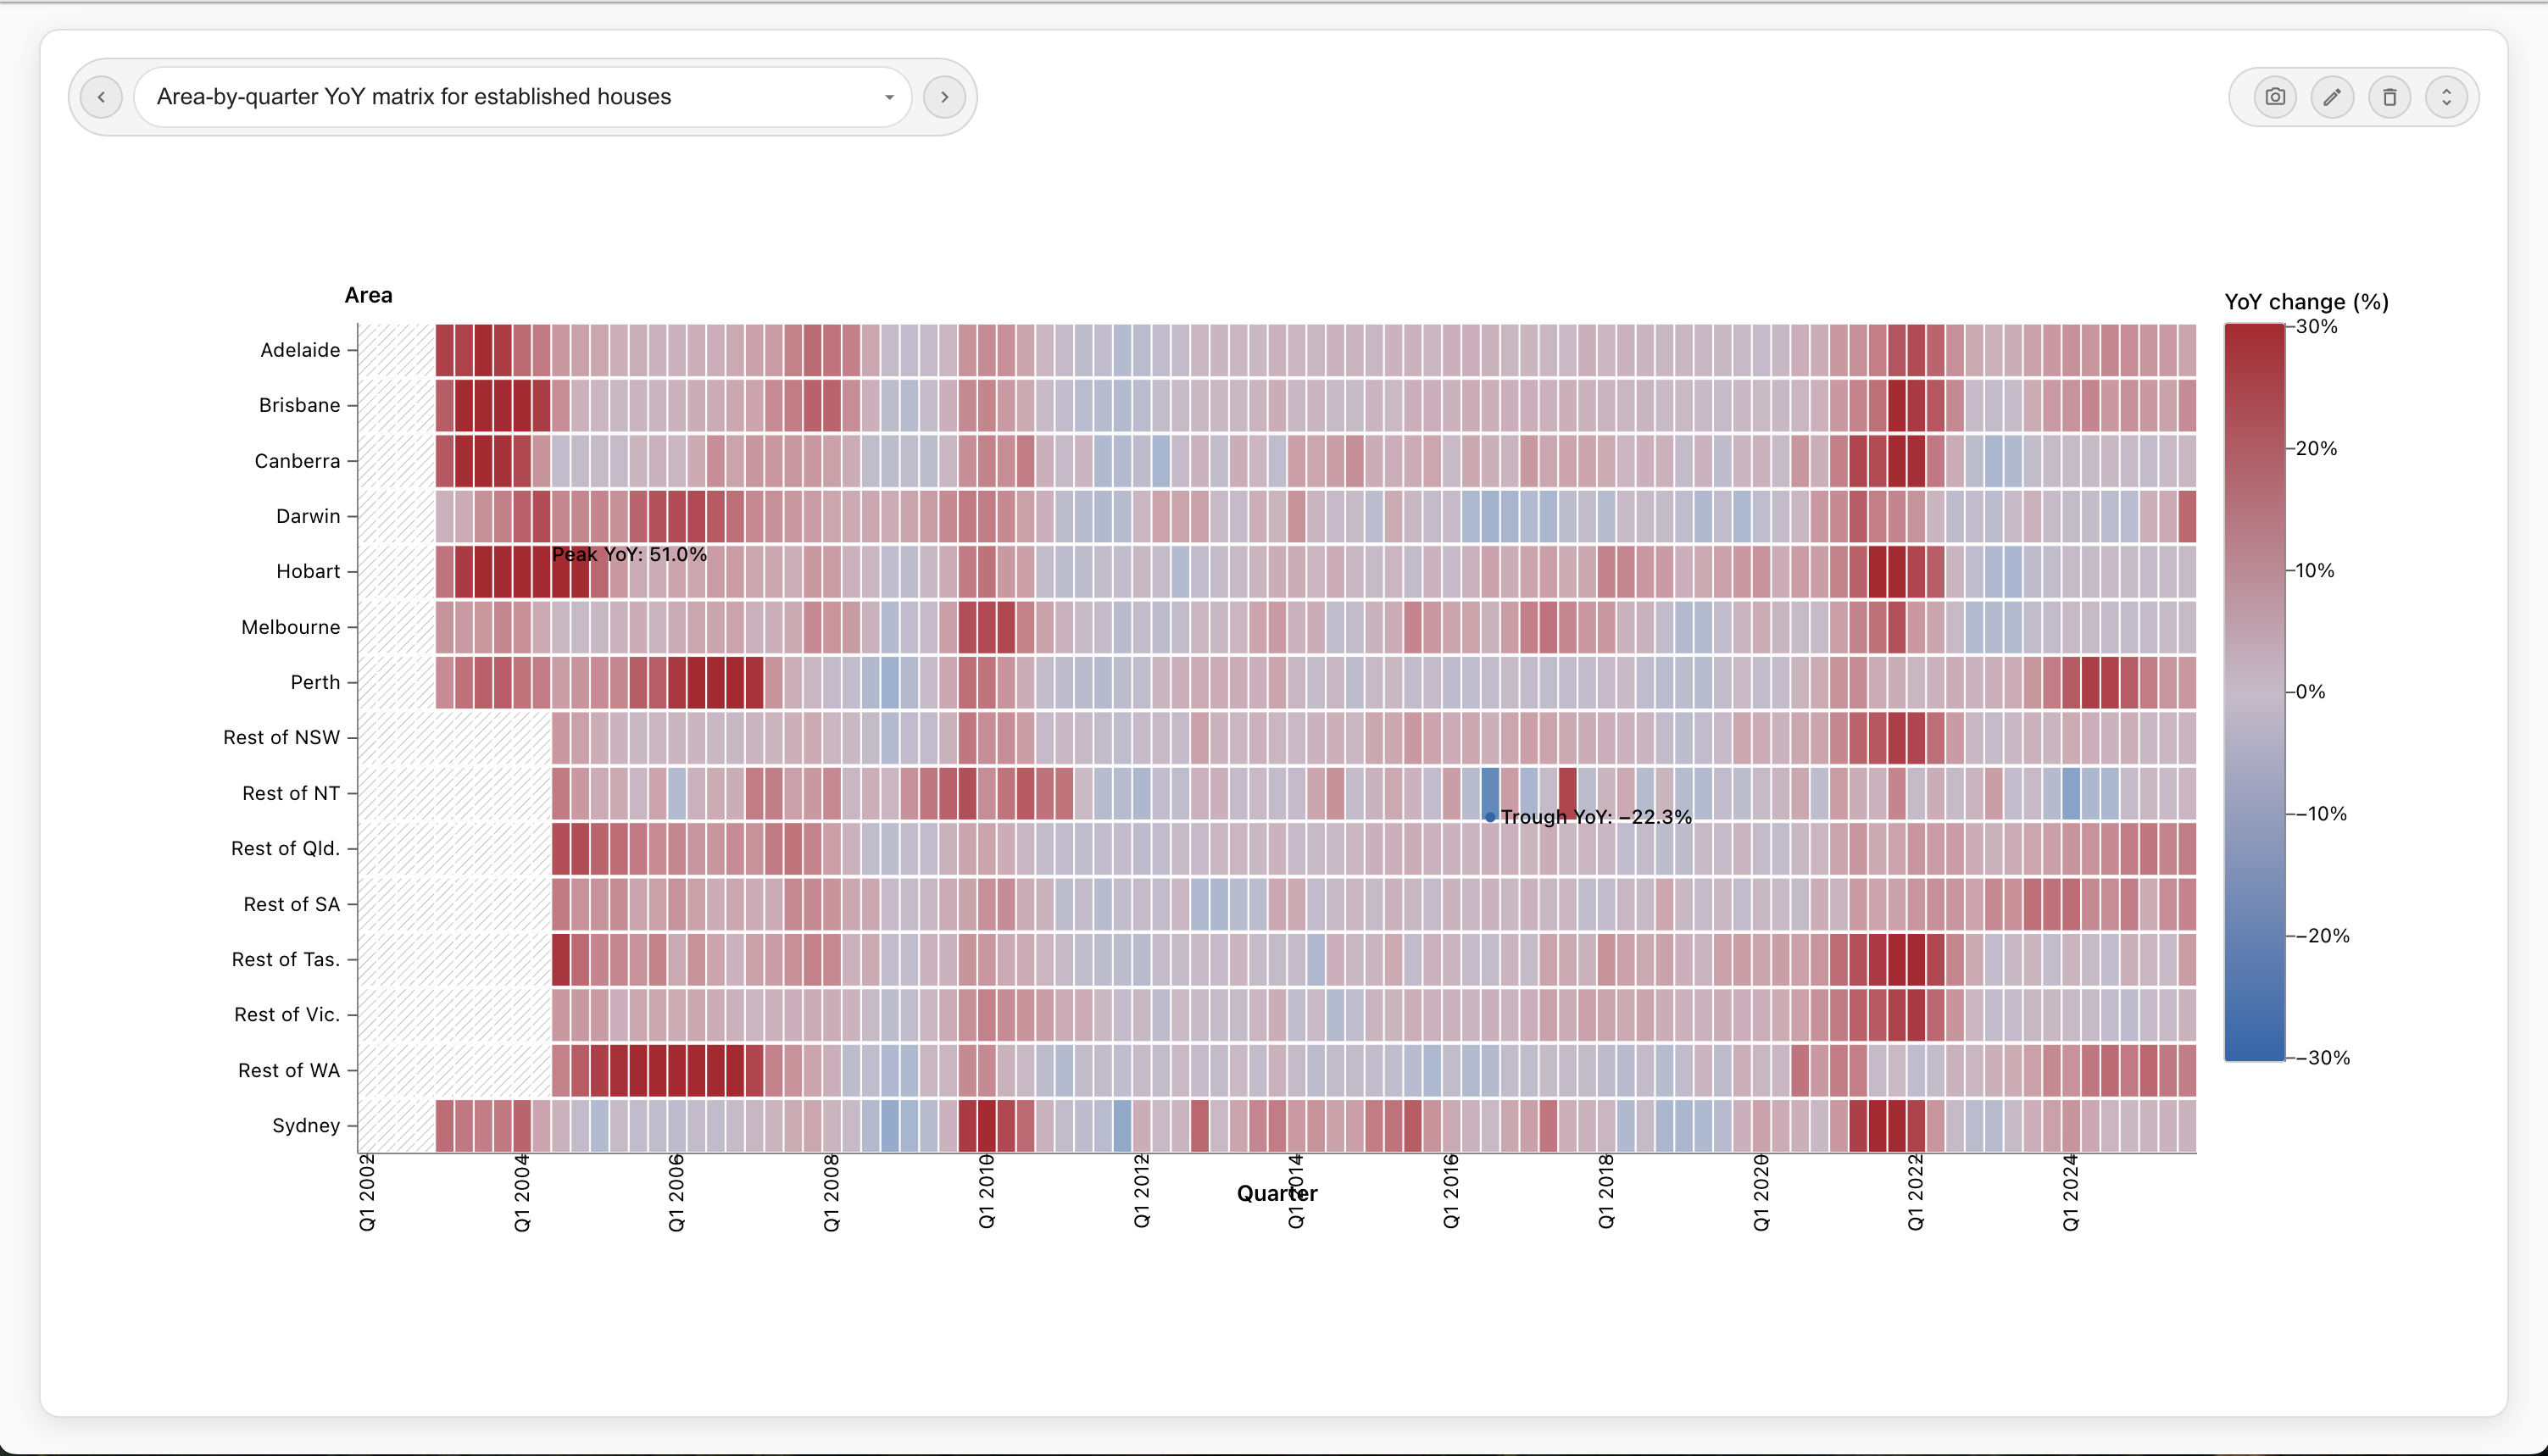
StoriBot can create a variety of data graphics, including charts, graphs, and other visual representations of data. It can also generate written summaries and insights based on the data provided. The specific types of infographics and insights will depend on the data and the prompts given to the agents. As a guide prompt it for an infographic, charts, scenario analysis or an animation. You can also just ask it for insightful charts as it is designed to generate its own ideas
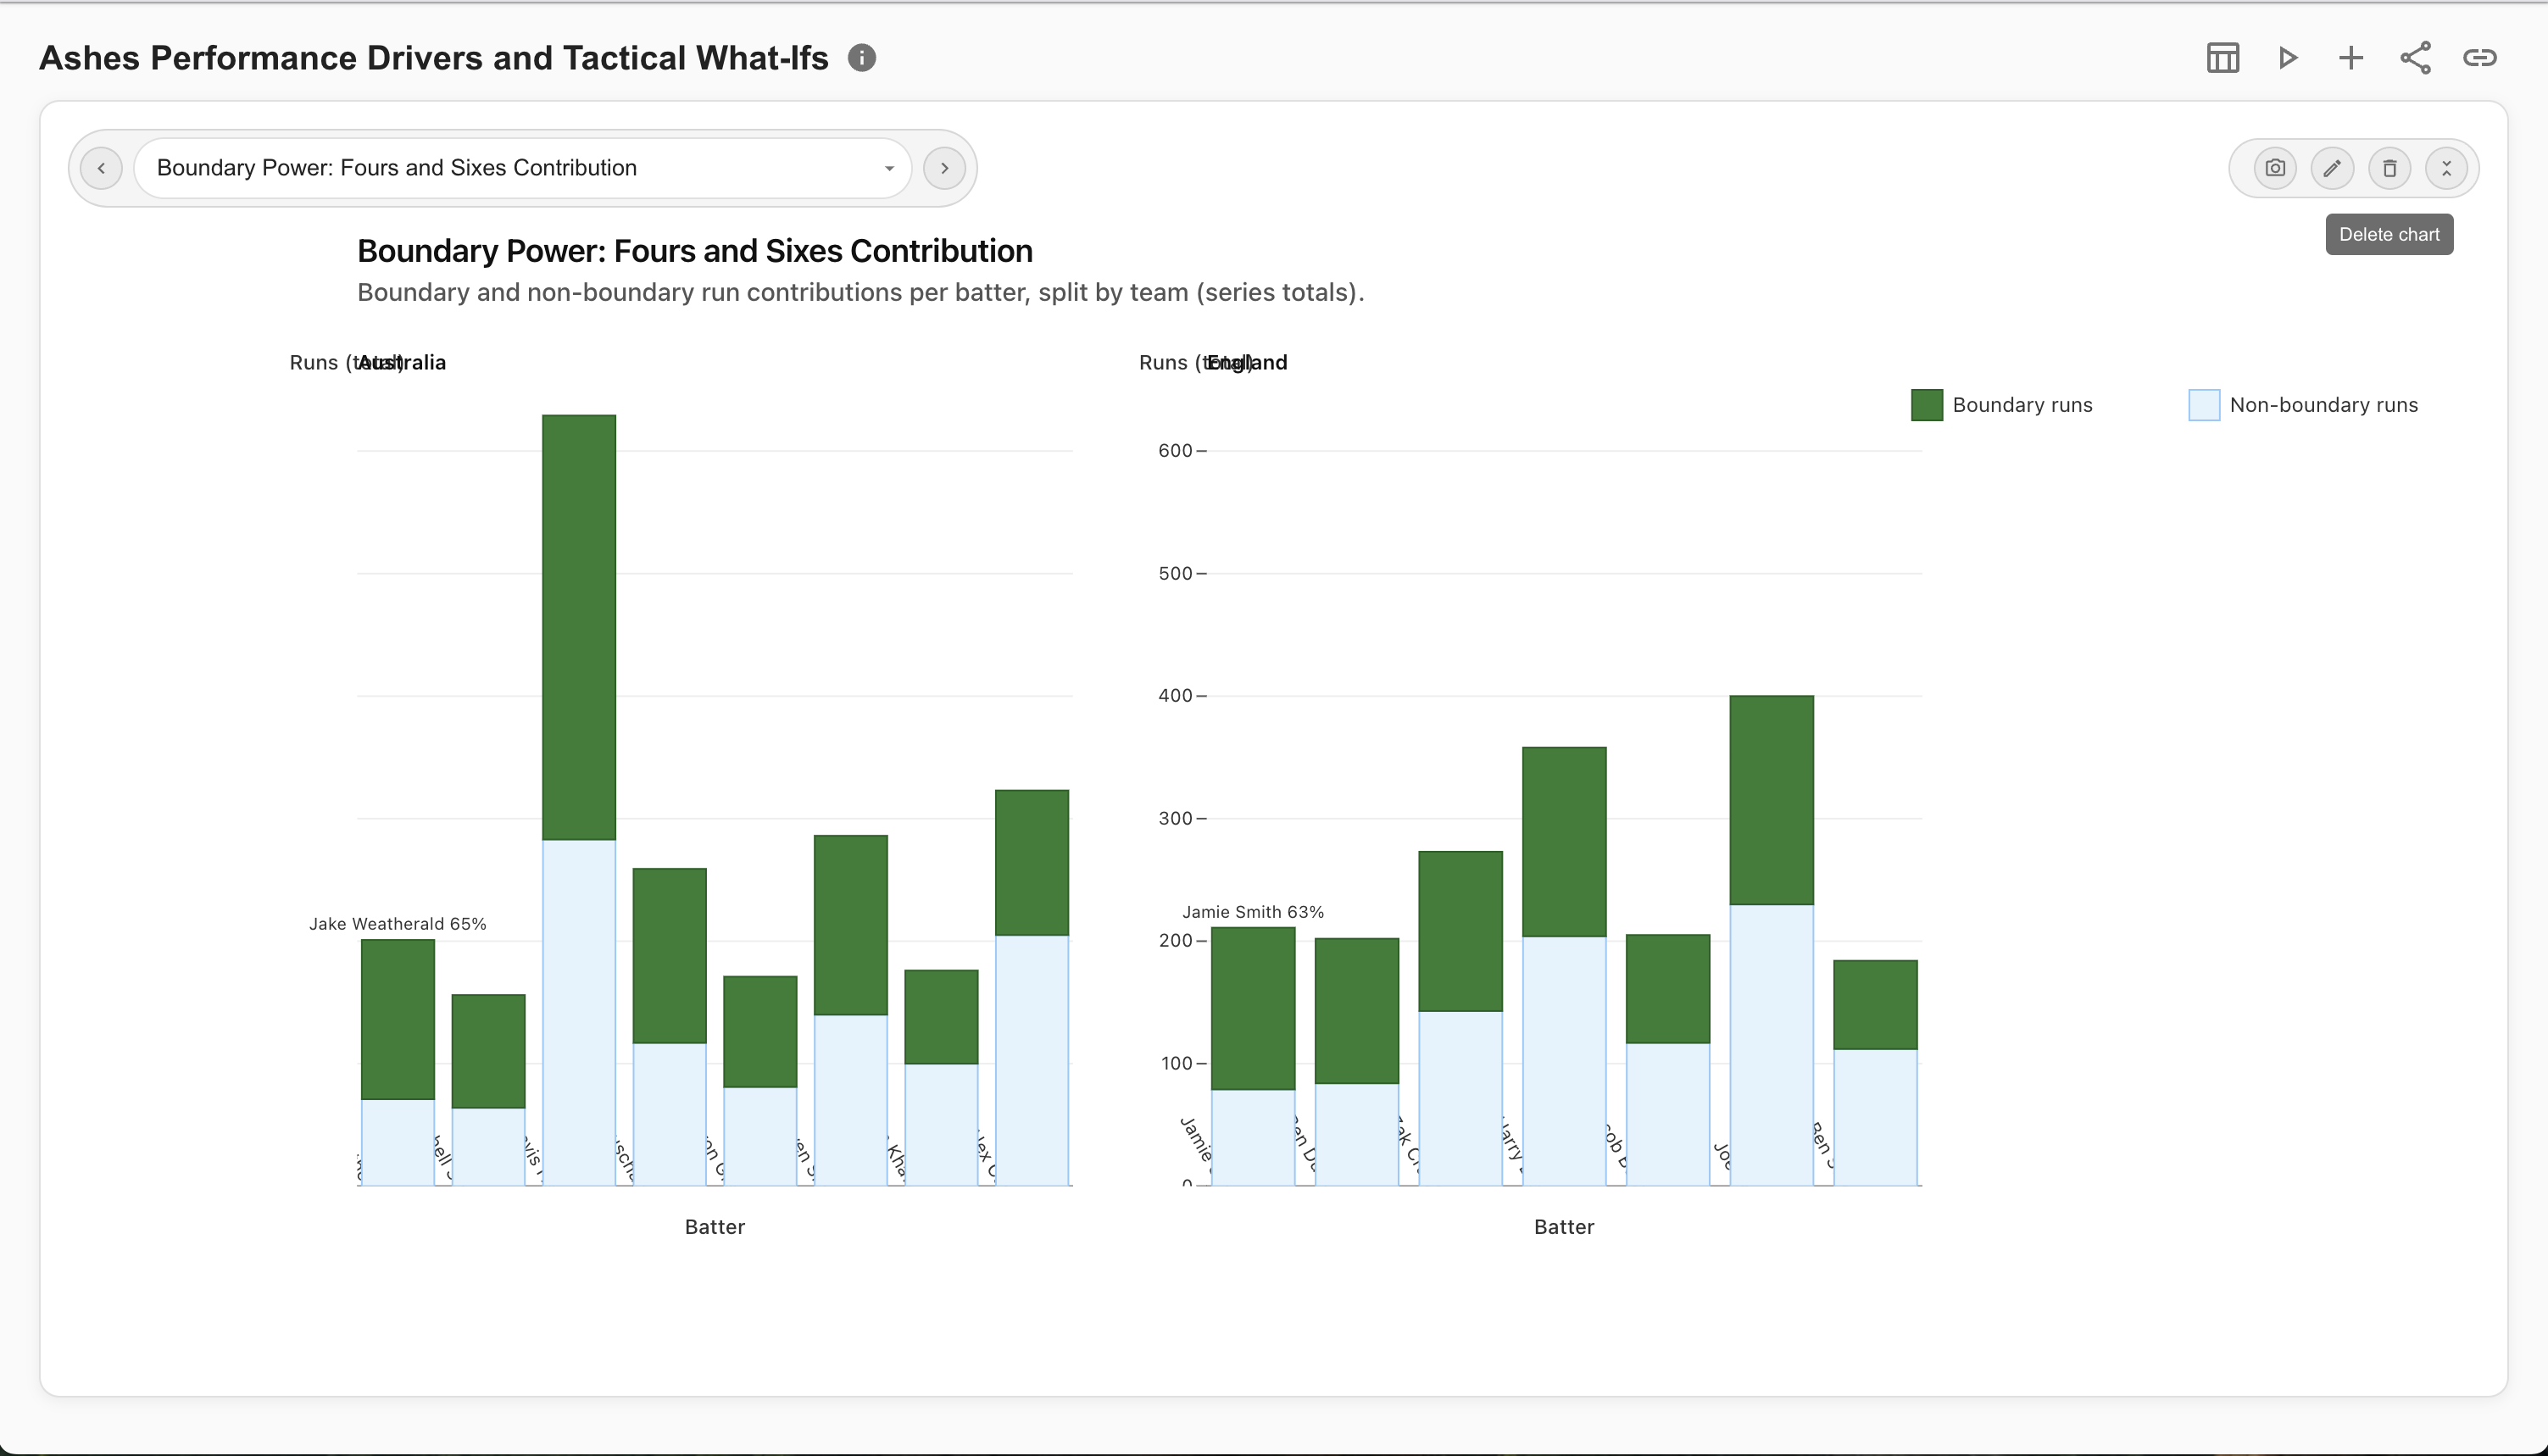
Yes, you can add additional graphics, edit existing ones, delete those that are not working for you, and ask the agent to generate new ones based on follow-up questions.
When you share a Stori you can set an expiry date for the link, create an allowlist of emails that can access the link, enforce that the user be authenticated to view the Stori or enforce that they are part of your StoriBot instance. You can also revoke access to the link or change any of these settings at any time. If you update the data graphics in a Stori simply refresh the artifacts and all pre-existing share links will show the updated graphics.
Yes, StoriBot is designed to ensure the privacy and security of your data. All data is handled in accordance with strict privacy policies and security measures. Your data or any insights are no shared with any third parties and is only used to generate the infographics and insights you request.
Coming Soon... we will let you customise the agents in StoriBot for your analytics needs. This lets you tune the outcomes to your preferred metrics, for matting rules, brand styling and domain context. Once configured, an agent analyses any new data the same way, so your reports are consistent every time.