Your Google Sheet has the data. Your client needs a report. Here's how to go from one to the other in under 10 minutes — without screenshots, slides, or a BI tool.
The painful way most teams do this
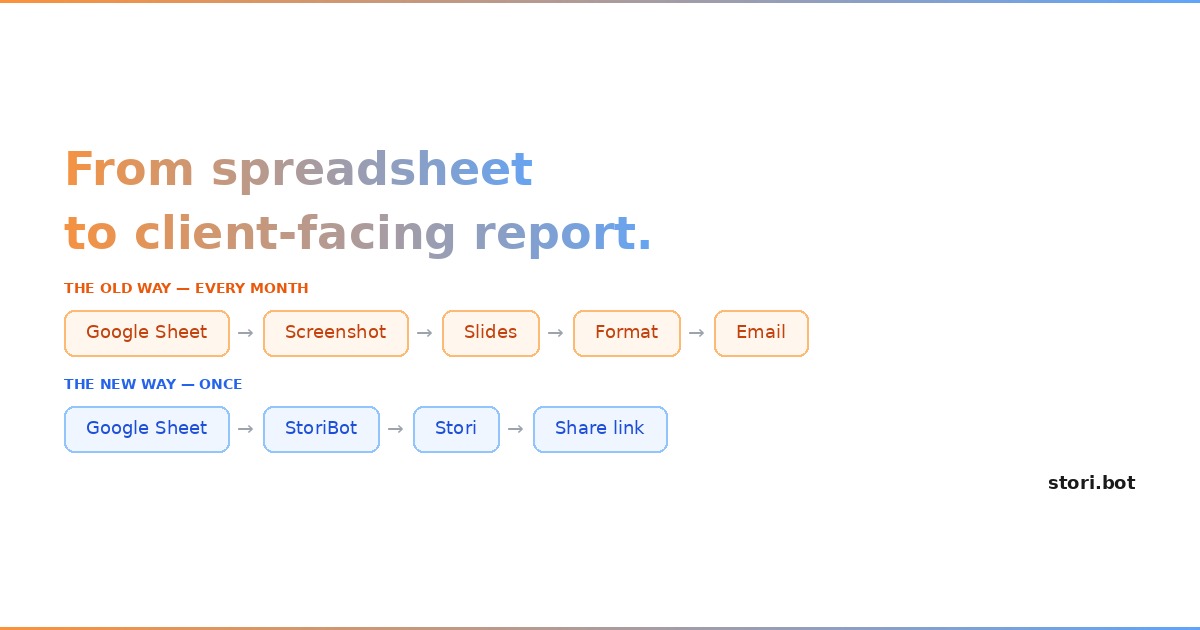
You know the drill. It's Monday morning and a client report is due. So someone opens Google Sheets, highlights a few cells, screenshots a chart, pastes it into Google Slides, and starts manually formatting numbers into a presentation. An hour later, there's a static deck that's already out of date.
The next week? Same thing. Same spreadsheet. Same copy-paste routine. Same formatting. Different numbers.
It's not that the data is hard to get — it's already sitting in Sheets. The problem is that there's no clean path from a live spreadsheet to something a client can actually read, explore, and trust. So teams fill the gap with manual work: exporting CSVs, rebuilding charts in Slides, colour-coding tables by hand.
That's not reporting. That's assembly work.
A better approach: connect, configure, share
StoriBot takes a different path. Instead of exporting and rebuilding, you share your Google Sheet and let a custom agent turn it into a series of interactive, shareable data graphics — a Stori. You configure it once. When the data changes, you hit replay.
Here's what the workflow looks like.
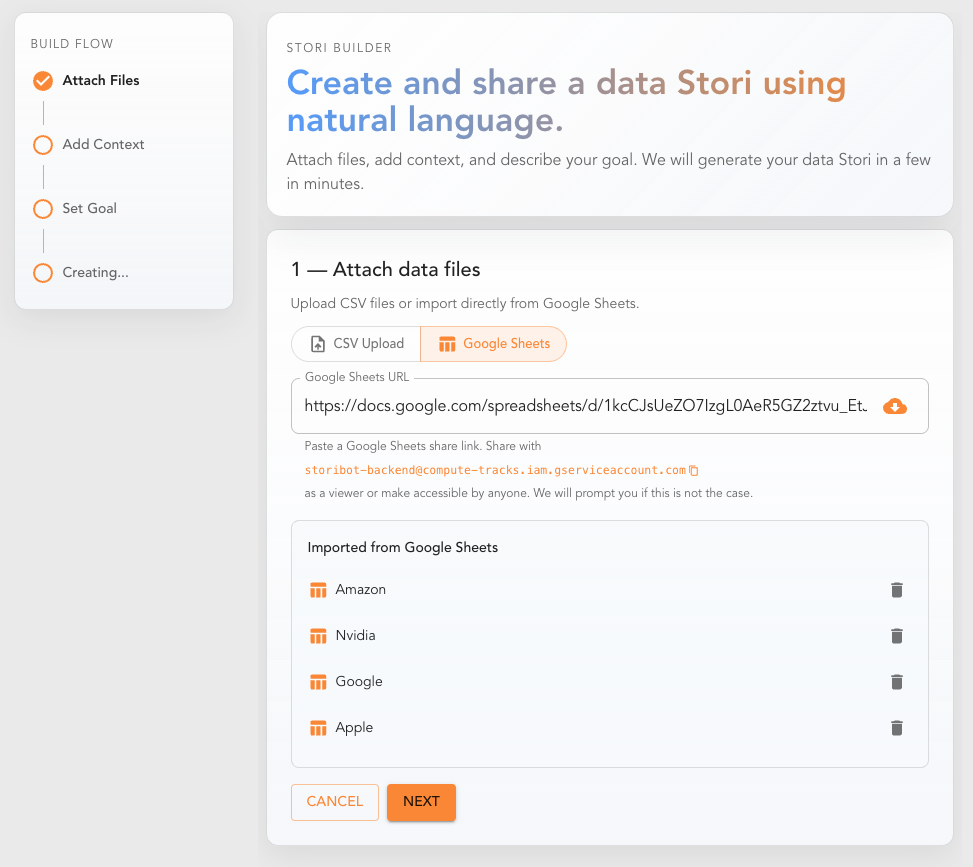
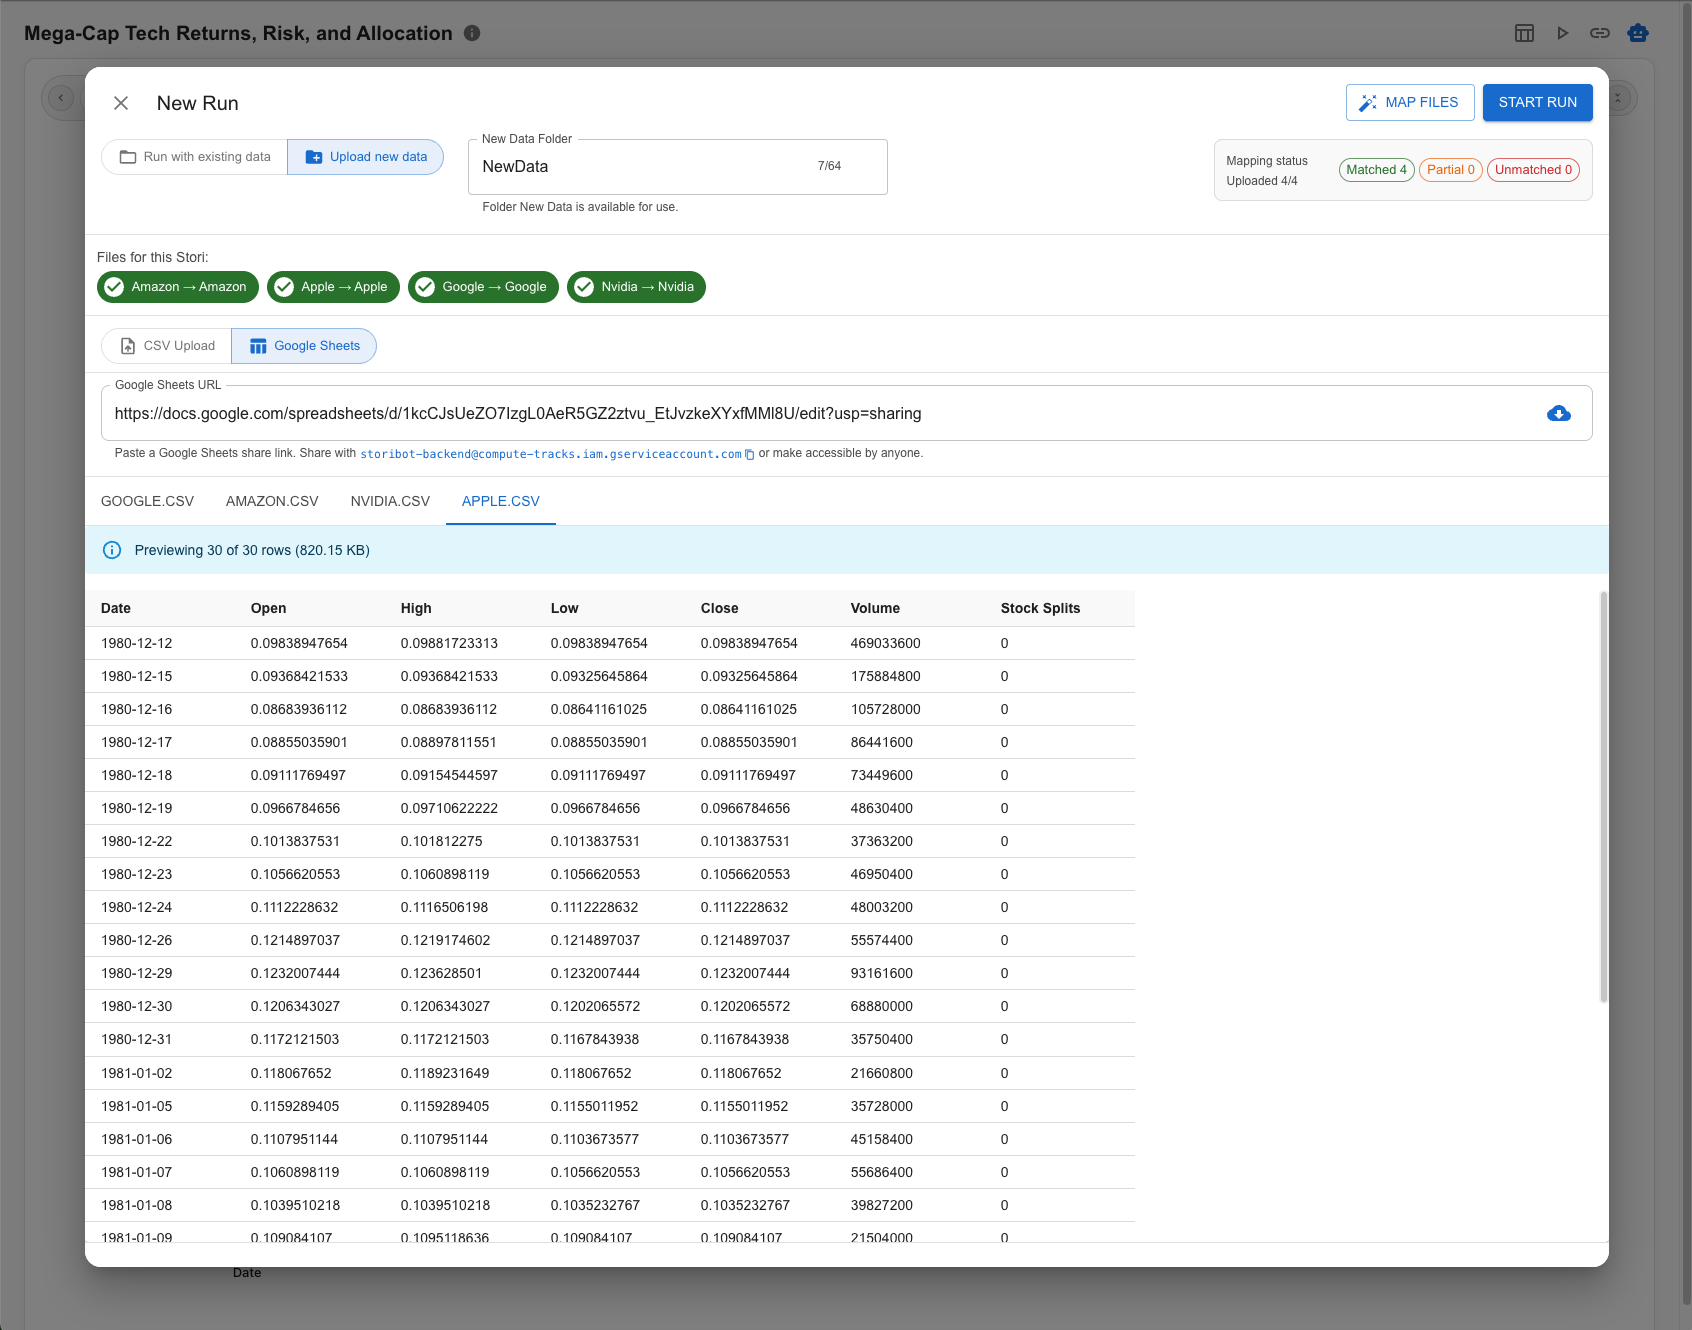
Step 1: Connect your Google Sheet
There's no complex integration. Either share your Google Sheet with StoriBot's service account, or make it "Anyone with the link can view." Paste the link into StoriBot, and it reads the data directly.
No OAuth flow. No credentials to manage. No API keys.
Why it matters: Your data stays live. The Stori will always pull from the current version of the sheet, so you're never working with stale numbers.
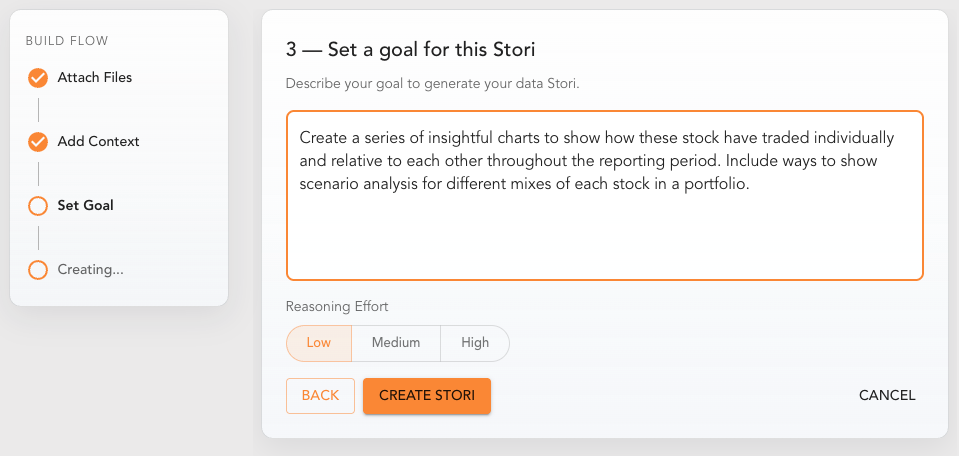
Step 2: Describe what the report should show
This is where StoriBot differs from a chart builder. You don't just pick columns and chart types — you tell the agent what the report should communicate.
For a client performance report, you might write something like:
"Create a monthly performance summary for our marketing client. Lead with total spend vs. budget, then show channel-level breakdown (paid search, social, display). Highlight any channels that exceeded target CPA by more than 15%."
The agent reasons through your data, codes the visualisations, and deploys a series of full-screen data graphics — each one designed to communicate a single insight. Charts, infographics, animated data sequences, even interactive scenario analysis. You swipe through them left to right like a story.
This takes about 8–10 minutes. The agent is reasoning through your data and building custom graphics, not just dropping numbers into a template.
Why it matters: You're encoding your reporting logic, not just your data. The agent knows what "good" looks like because you've told it.
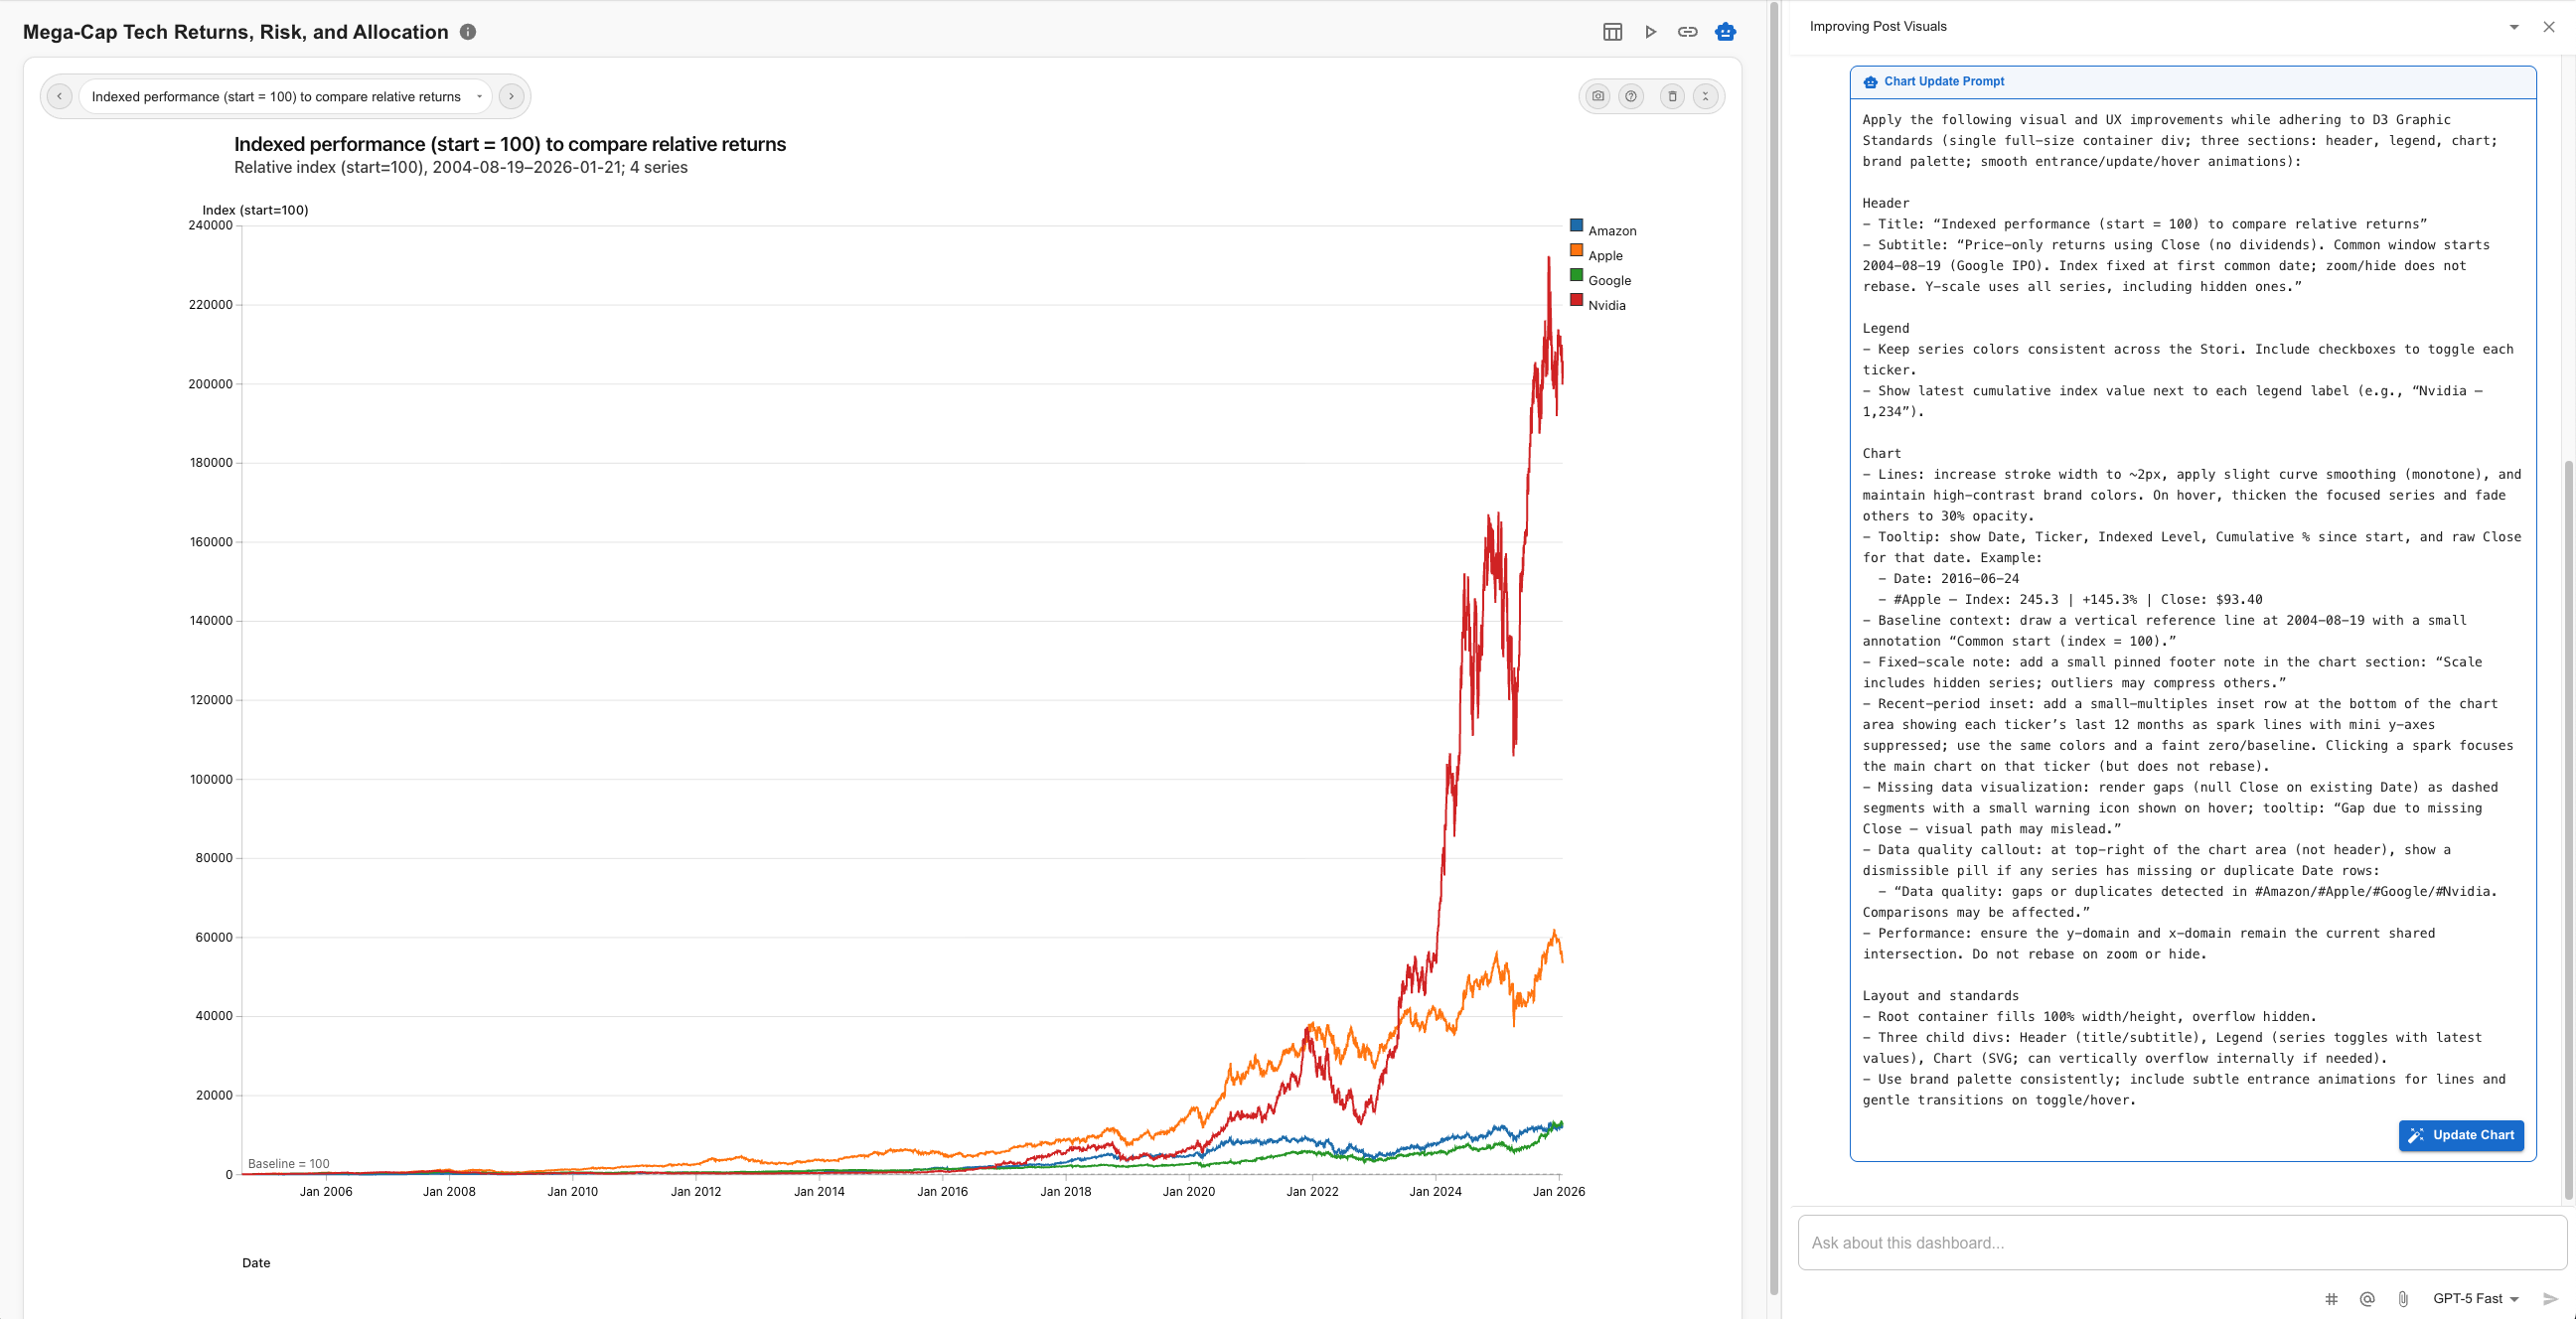
Step 3: Review and refine
Swipe through the graphics. Each one takes up the full screen — designed to land a single point clearly. If something's off, open the chat interface on any graphic and talk to the agent.
You can ask it to explain a graphic, improve the design, or write you a narrative to go with it. You can share a screenshot or reference specific data points to improve the agent's understanding. From the chat, you can trigger "update graphic" to refine what's there, or "add graphic" to insert a new one into the sequence.
Why it matters: You're editing intent, not pixels. The agent rebuilds the graphic based on your feedback — you don't touch code or chart settings.
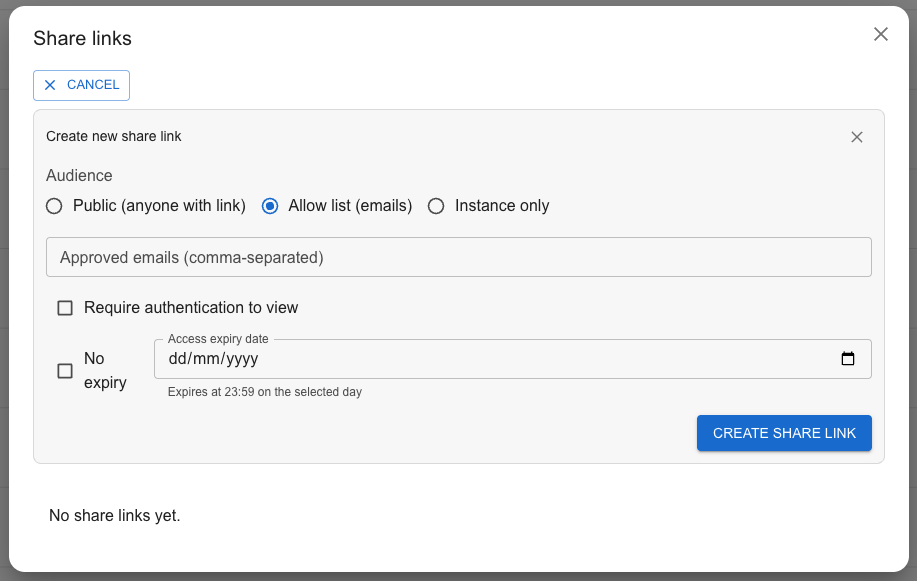
Step 4: Share it
Once the Stori looks right, generate a share link. You control access:
- Public: Anyone with the link can view the Stori.
- Allow-list: Only specific email addresses can access it.
- Authenticated: Viewers need to sign in.
Each option can be set to expire after a date or remain active indefinitely. Need a static version? Hit the screenshot button to capture any graphic with one click.
Why it matters: Your client gets a polished, interactive report without needing a Google account, a BI licence, or access to your spreadsheet. You control exactly who sees it and for how long.
Step 5: Replay when the data changes
Here's where the manual grind disappears. When the next reporting period rolls around and your Google Sheet has fresh numbers, hit "Replay." StoriBot re-runs the same agent instructions against the current data and produces a fresh Stori.
Same structure. Same reporting standards. New data. One click.
Why it matters: You've turned a recurring manual task into a configured, repeatable process. The agent remembers your reporting standards so you don't have to rebuild from scratch every month.
Three ways to use this
Agency monthly report. A marketing agency shares their client's Google Sheet (spend, conversions, CPA by channel) and configures an agent that produces a series of data graphics — channel performance, budget pacing, top campaigns. When next month's numbers land, they hit replay and send a fresh share link instead of a 20-slide deck.
Internal sales pipeline review. A sales ops lead shares the pipeline tracker from Sheets. The agent generates a set of graphics: deals by stage, total weighted value, stalled opportunities flagged. The team swipes through the Stori in Monday standup instead of scrolling through a spreadsheet.
Quarterly board update. A startup founder shares financial data from Sheets — revenue, burn, runway. The agent builds a concise set of graphics with trendlines and scenario analysis. When the quarter closes, the founder hits replay and has the update ready in minutes.
Try it with your own data
Connect a Google Sheet and create your first Stori in under five minutes. No credit card. No spreadsheet gymnastics.
Related reading:
- How to create an interactive dashboard from Google Sheets (without Looker)
- How to automate weekly reports from Google Sheets (coming soon)
- Why every reporting workflow needs a system prompt (coming soon)