In this post we pull back the curtain on what's under the hood of StoriBot, how we leverage that architecture to produce data graphics and how you can get started in agentic analytics.
What is a Stori?
A Stori is a self-contained, interactive data application that you can share with anyone. It's built from the data and prompts you provide the agent — meaning you control what it shows, how it displays, and when it updates. The variety of web pages you can make with StoriBot is largely limited by your imagination, data and prompting.
Build what your audience wants and needs
Your audience is just that — yours. Whether it's your boss or your client, you get to decide what they see. You can build niche dashboards, maps, slides and scrollytelling web pages all from the same tool and all using natural language prompts. Need filter views for your Sales Manager? Done. Swipes between charts for Finance? Easy. Then create a share link for your audience and set the access levels and expiry.
The StoriBot difference
StoriBot's advantage is its lack of learning curve and its variety of outputs. If you can describe what you want and have the data you can have it in a webpage.
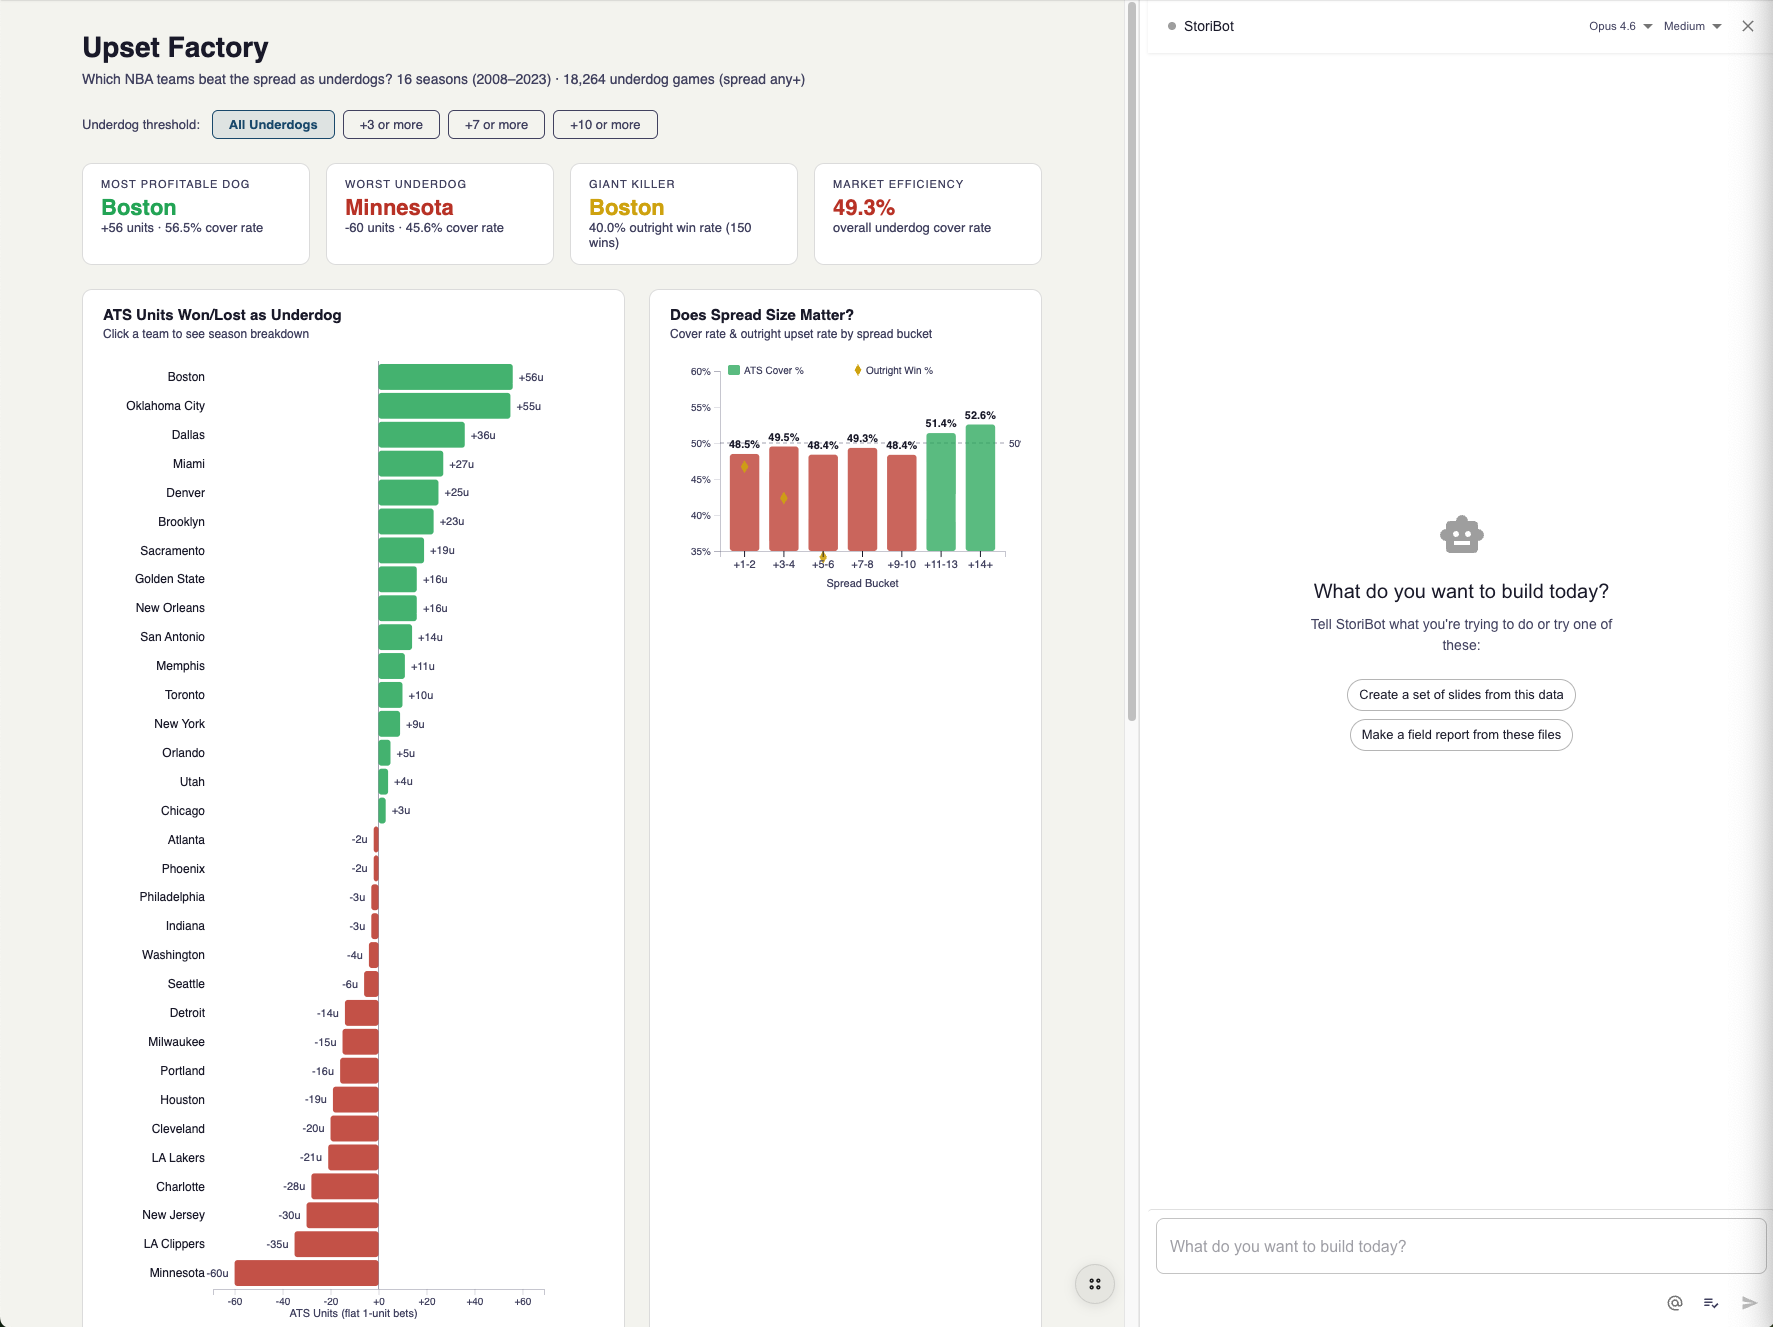
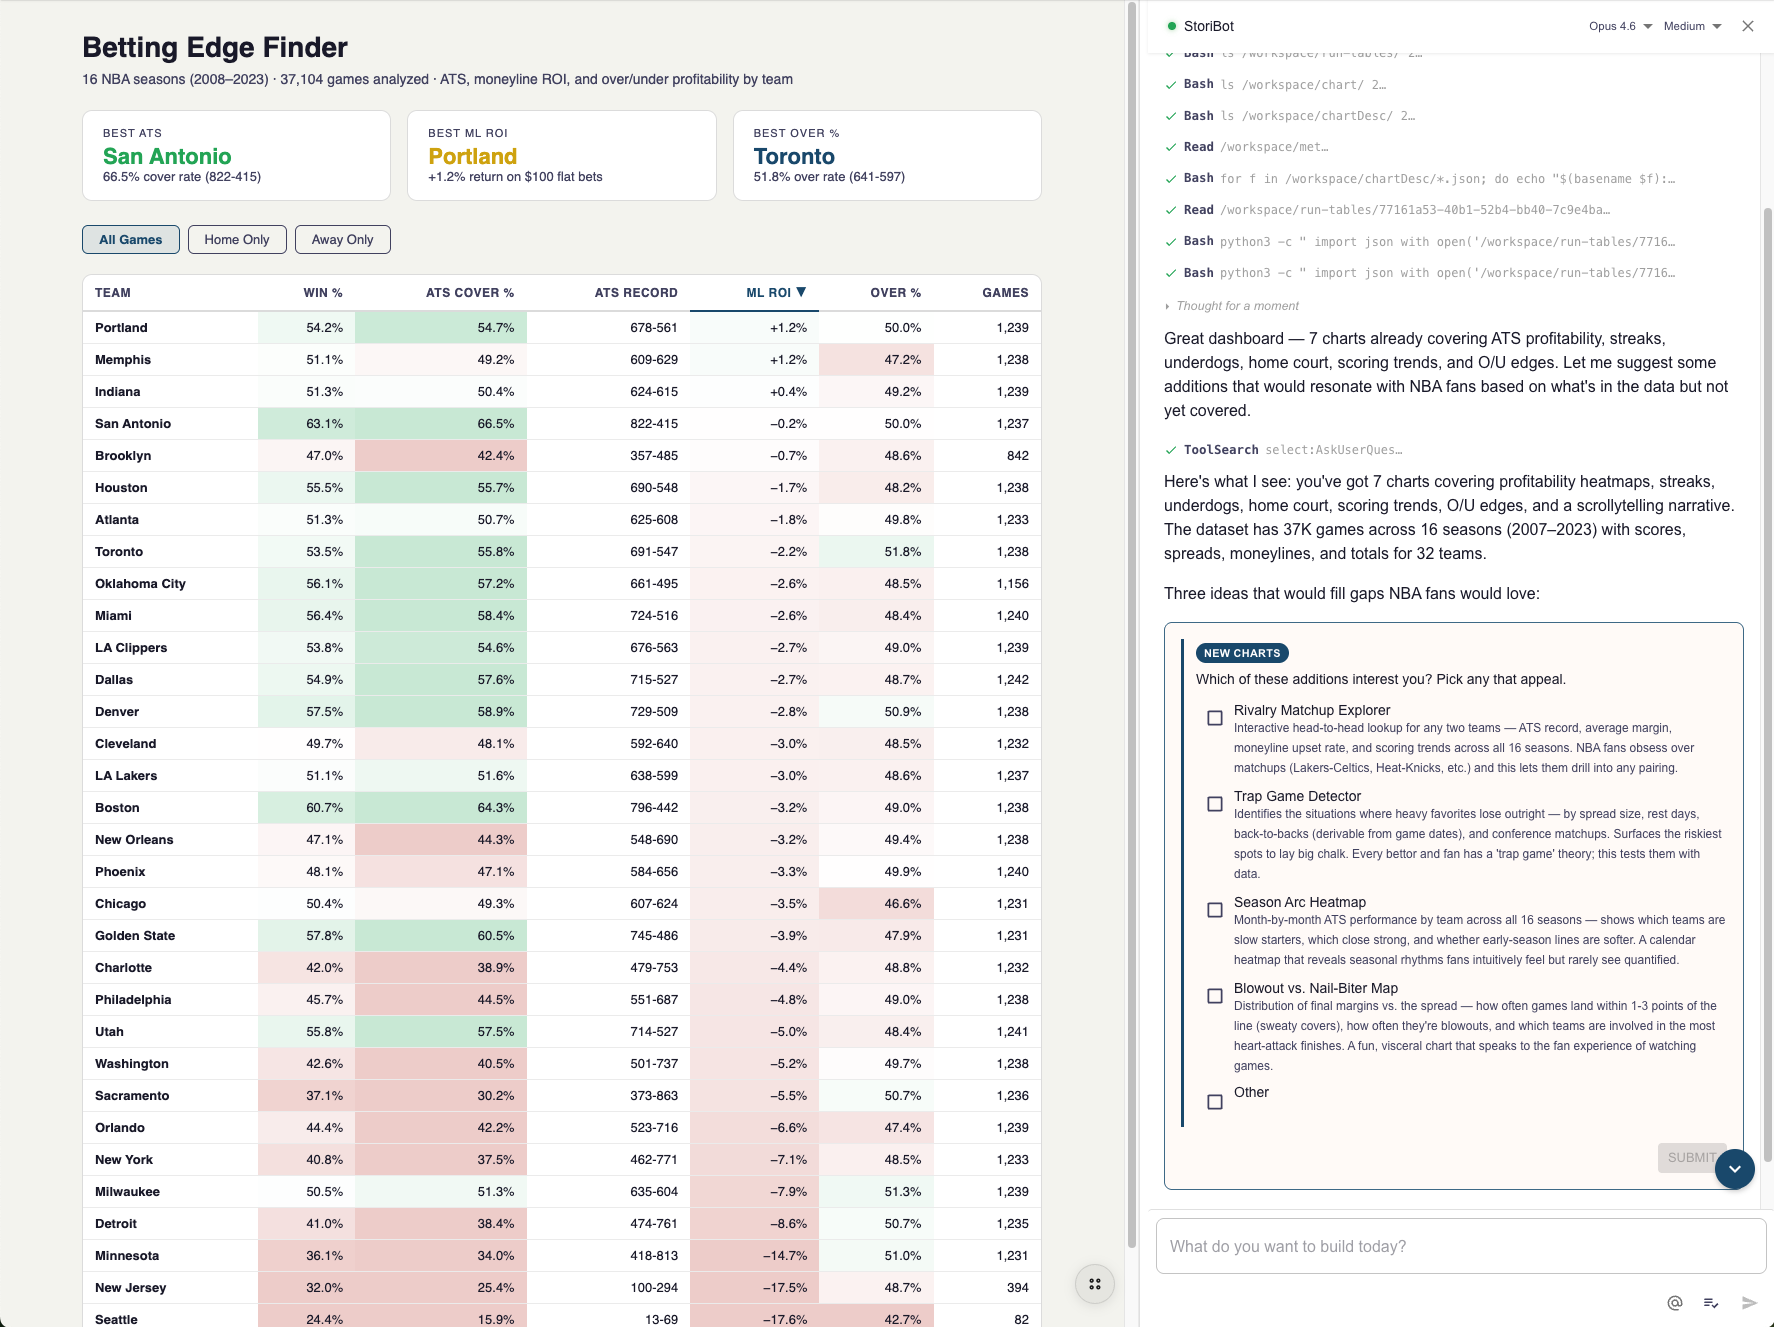
If you are unsure what might land well, tell StoriBot about your audience and what you're trying to acheive. It will review the data, ask any outstanding questions and make suggestions about what you can build together.
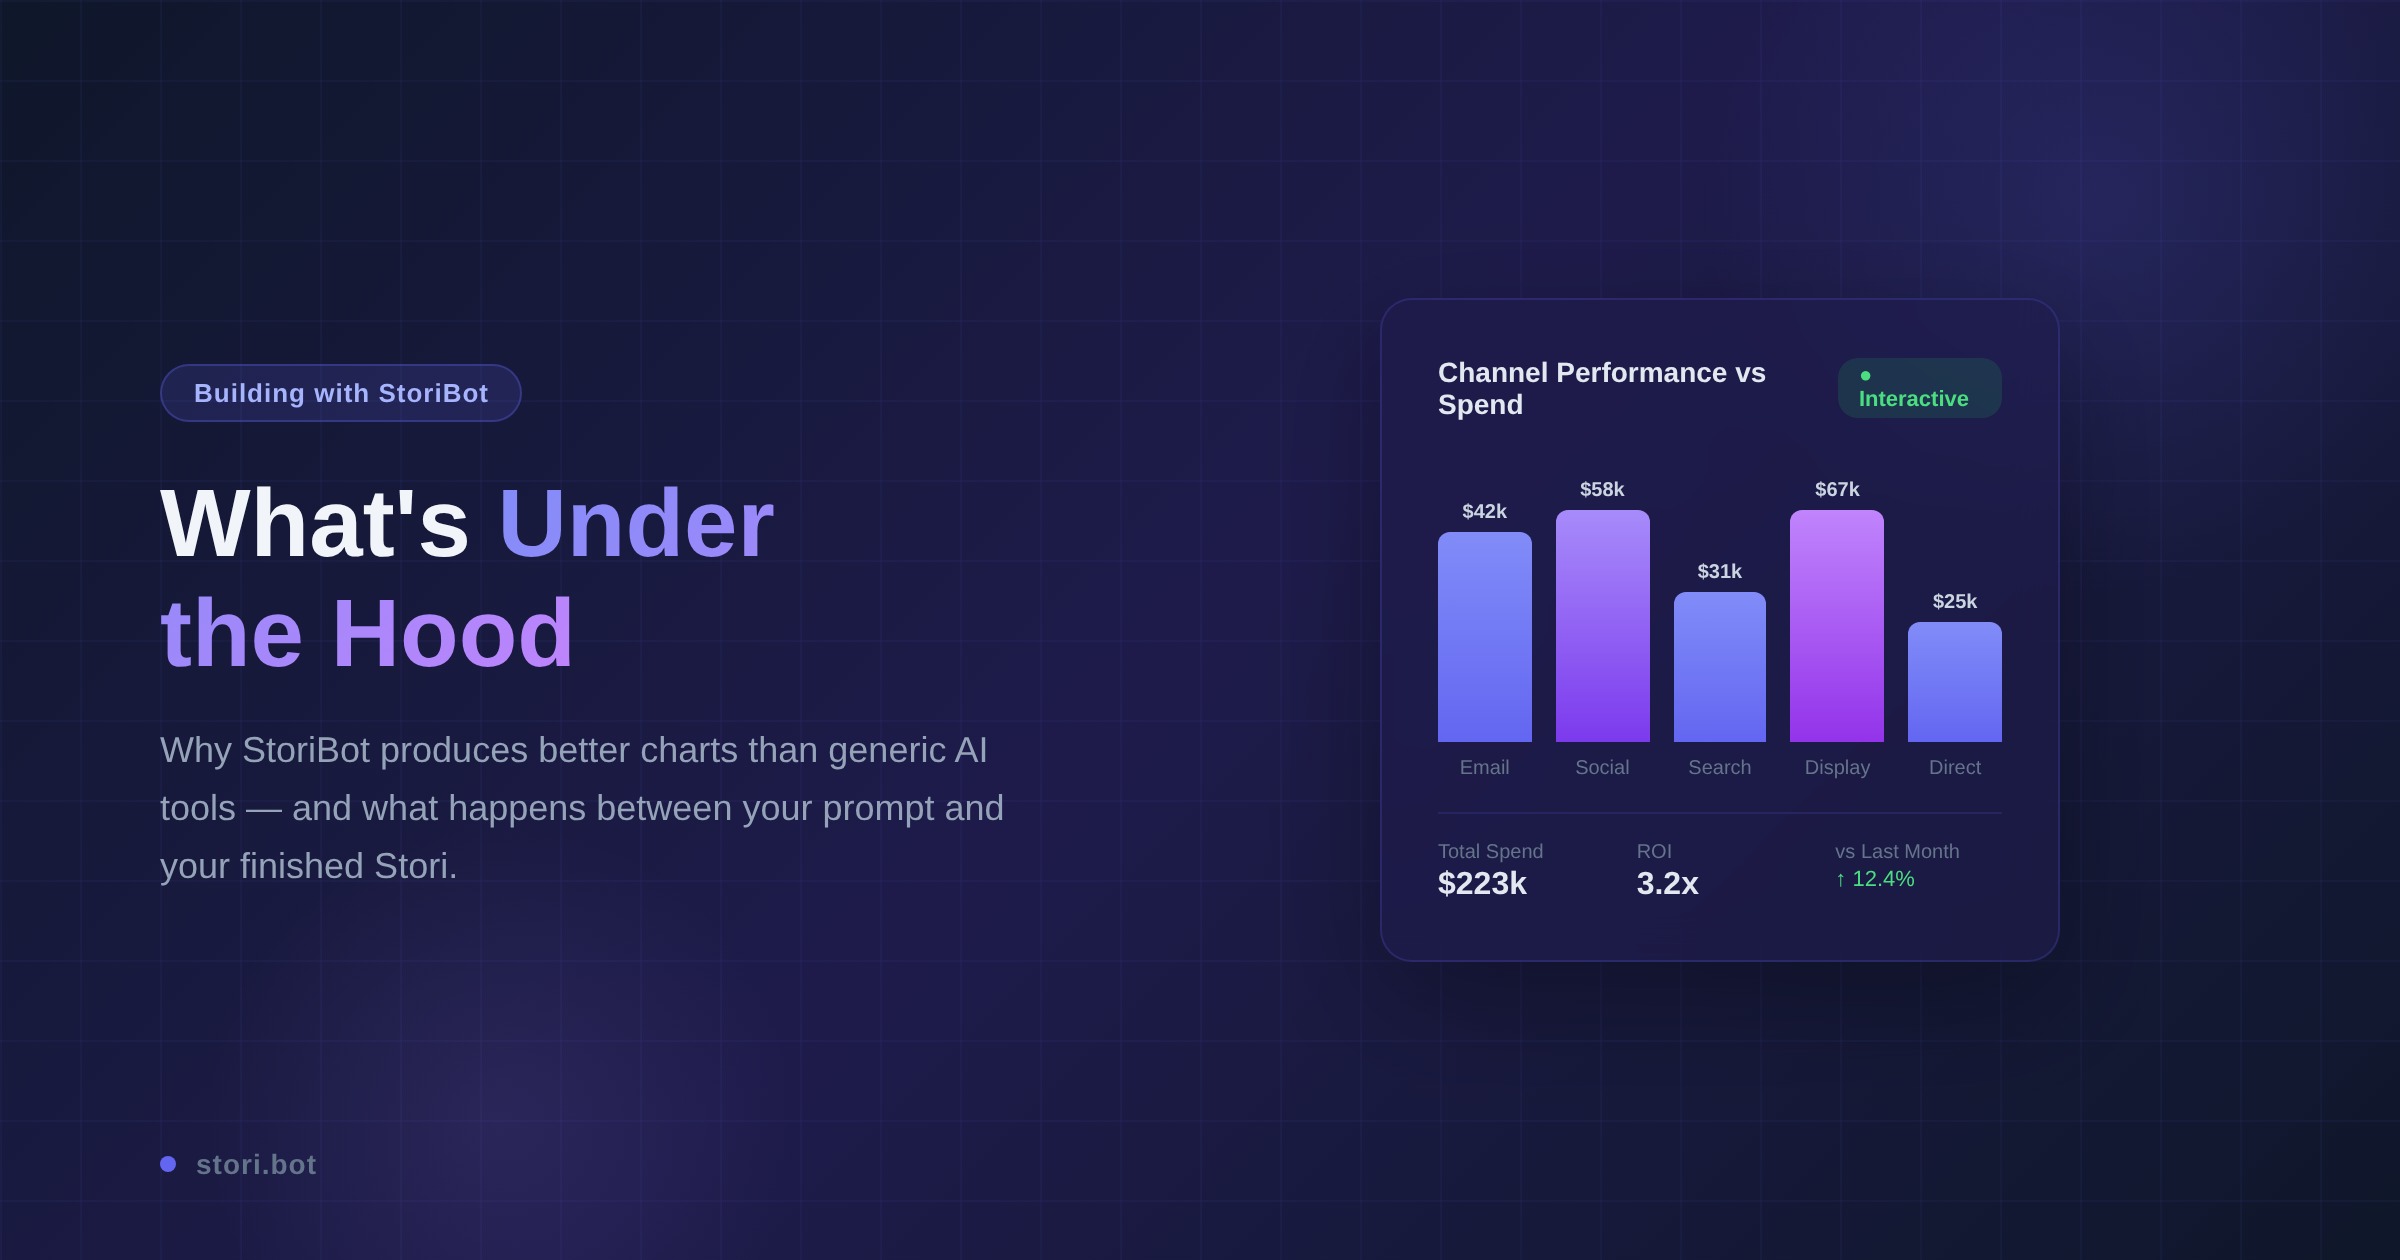
This isn't just a friendlier interface. It changes the quality of the output too. When you tell StoriBot "show me which marketing channels are underperforming relative to spend," it doesn't just make a chart. It chooses the right chart type for that comparison, picks a colour scheme that highlights the key insight, and adds context that makes the story clear to someone seeing it for the first time.
Most BI tools are constrained to the common visual outputs. StoriBot gives you a much wider variety of outputs and more control over the final product.
What makes a Stori
Behind every Stori, there are several connected pieces: the visualisation code, the data tables, an audit trail and a data lineage that records how numbers were calculated tying them back to sources for you.
All of this is available to you in a compute environment with a world class coding agent, that's what makes a Stori happen. Its not BI with AI added its AI reimaging how to deliver business intelligence.
You don't need to manage any of this — StoriBot takes the load. When you make a change, say you "switch this to a horizontal bar chart" or "change the colour palette" — everything updates together. The title adjusts. The data mapping stays correct. The audit trail records what changed and you can fresh your share links so you can make changes even after you have shard your Stori.
Automated quality checks - before you see it
Every chart StoriBot builds gets reviewed before it's shown to you for output quality. StoriBot has its own tools to evaluate the outputs. Does the text overlap? Are the labels readable? Do the colours have enough contrast? Is the legend in the right place? If something's off, it fixes the issue and checks again — up to three rounds of self-correction.
This is like having your own design reviewer sitting beside StoriBot, catching the small things that make the difference between a good chart and a messy one. Overlapping axis labels on a bar chart with 20 categories? Caught and fixed before it ever reaches you.
Stories are also made mobile first out of the box. So often you share a link to your work and its opened on a mobile device. We observed this from the start so StoriBot builds all interfaces mobile friendly even going so far as to have differnt graphics for the same Stori on mobile and larger screens in some cases.
Data lineage built in - not an after thought
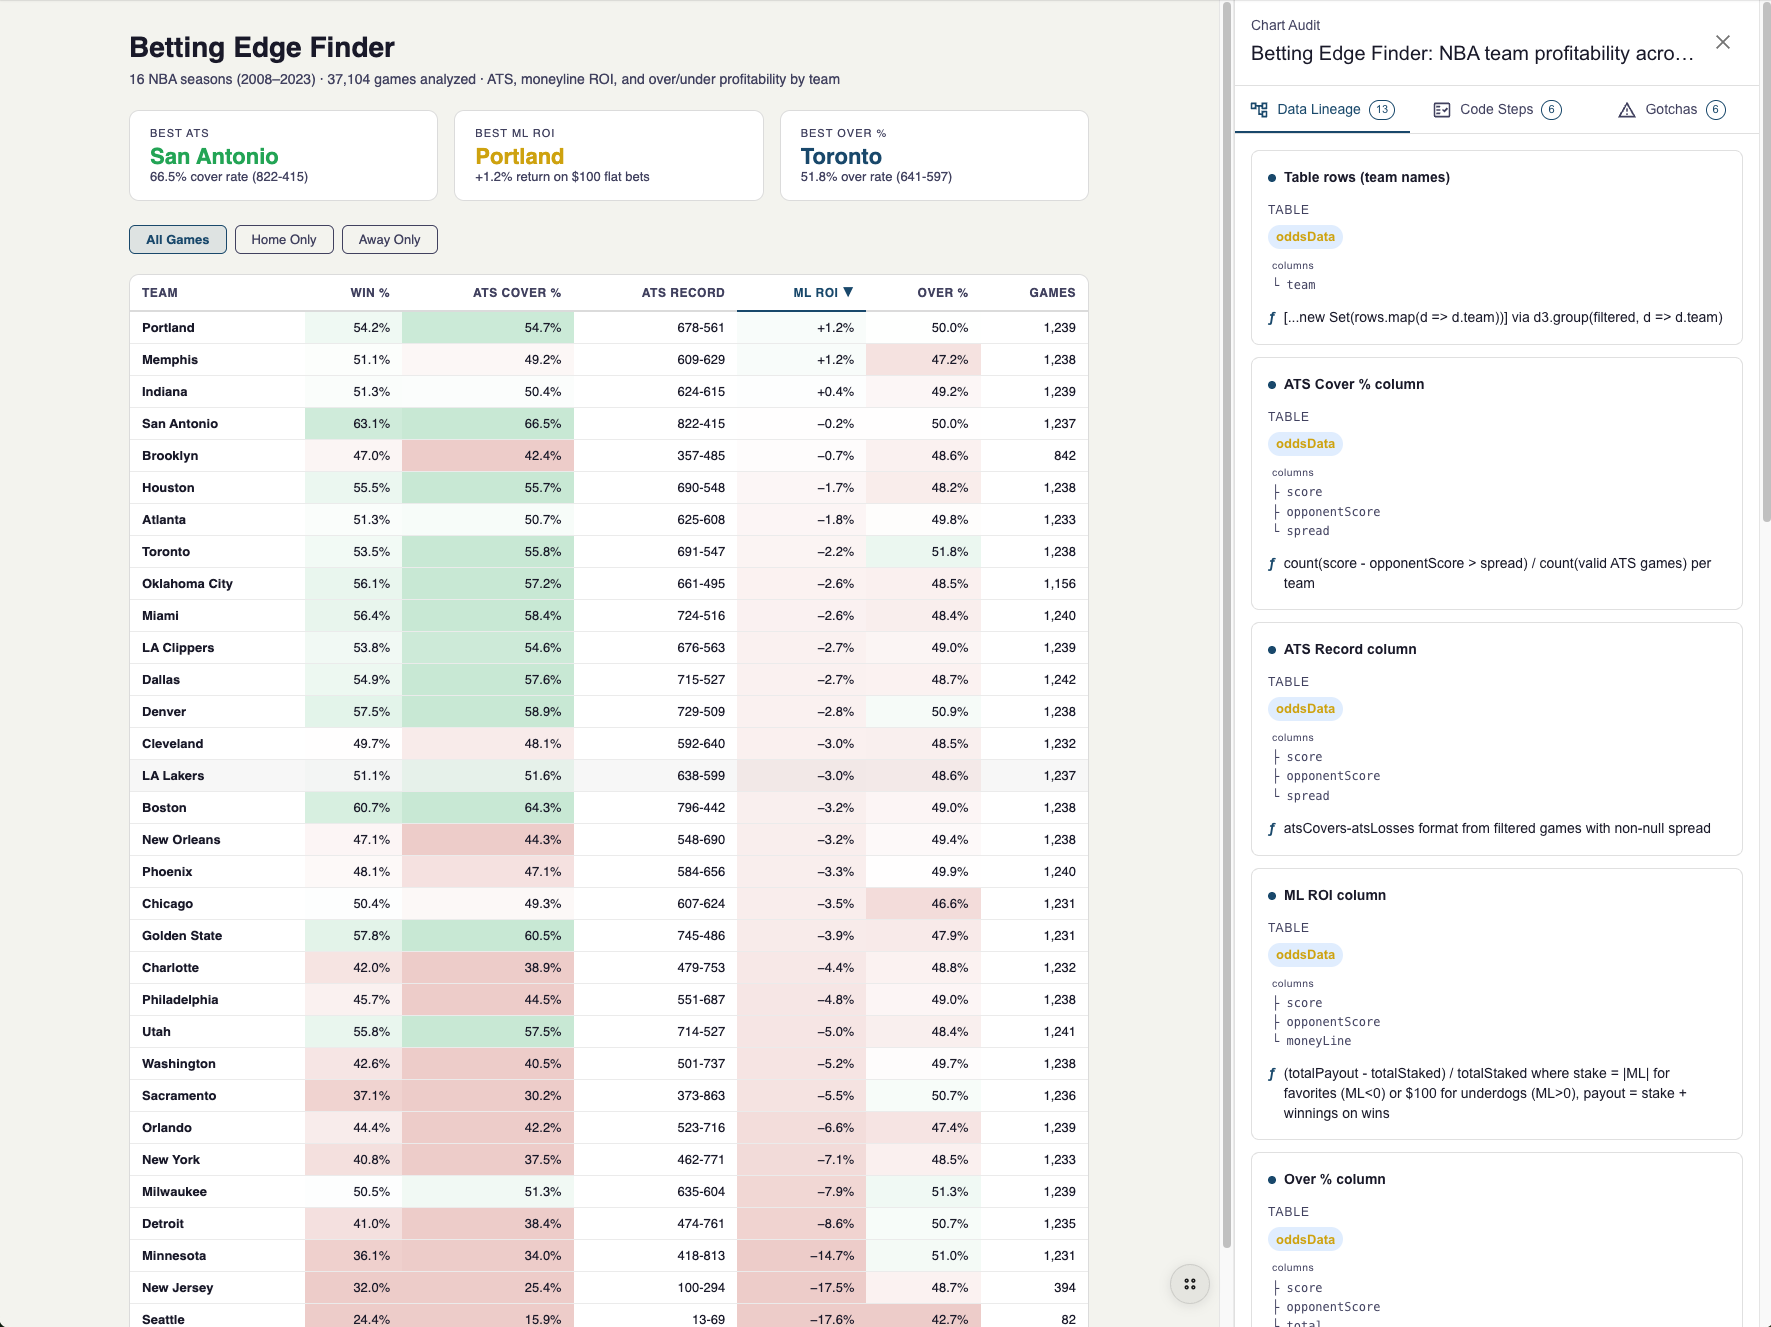
Further than a chart just looking good, you need to know you can rely on it, stake your reputation on it. To help with that every chart trace and data label in the interface is connected back to the underlying data source it comes from and any function that was performed to make it so.
Data lineage is updated with any edit and built into StoriBot as a first class object not an after thought. For each Stori you can see the data lineage, a description of the code steps and any 'gotchas', things that you might rely on or might trip you up in over interpreting a data graphic. Beyond just having the output, these additional features let you better explain to stakeholders what happened, where the data came from and the extent to which they can rely on it.
See it build in real time
StoriBot also updates live as it works. You can refresh the screen to see updates and suggest changes as you go. This matters more than it sounds.
When you can see the chart taking shape, you catch misunderstandings early. "Actually, I wanted monthly totals, not daily." "That's the wrong column for revenue." You course-correct in seconds instead of starting over.
It also means you can steer the output while it's being built. "Add data labels to the bars." "Make the target line red." "Swap the axes." StoriBot adjusts on the fly, and you never lose progress.
There's no save button. No deploy step. No waiting. What you see is what your audience will see. Create and refresh links as your edits are ready for sharing.
Theming and filtering — built in, not bolted on
Every Stori comes with theming and filtering out of the box. You don't need to configure these separately.
Theming means your Stori can match your brand — or your client's brand. Say "use our brand colours: navy and gold" or "make this look clean and minimal" and StoriBot applies a consistent visual style across every chart in the Stori. Theme and font changes are as varied as you can describe.
Filtering means your audience can also explore the data their way. A marketing agency report that covers six channels can let the client filter to just the two they care about. A sales dashboard that shows all regions can let each regional manager focus on theirs.
You don't need your data to already be filtered or pivoted a certain way. SotriBot can add any groupings, filters or pivots you need on the fly. Want something, just ask StoriBot.
Why this matters for your output
Every piece of this — the conversational approach, the connected architecture, the automated QA, the live updates, the built-in theming — serves one purpose: your output is better than what you'd build alone, and you get it faster.
That's the core idea behind StoriBot. It's not a tool that automates away your judgement. It's a collaborator that handles the technical execution while you focus on the story you want to tell.
See it in action
The best way to understand what's under the hood is to watch it work with your own data. Book a demo and we'll walk through how StoriBot works — live, in real time.
Related reading: