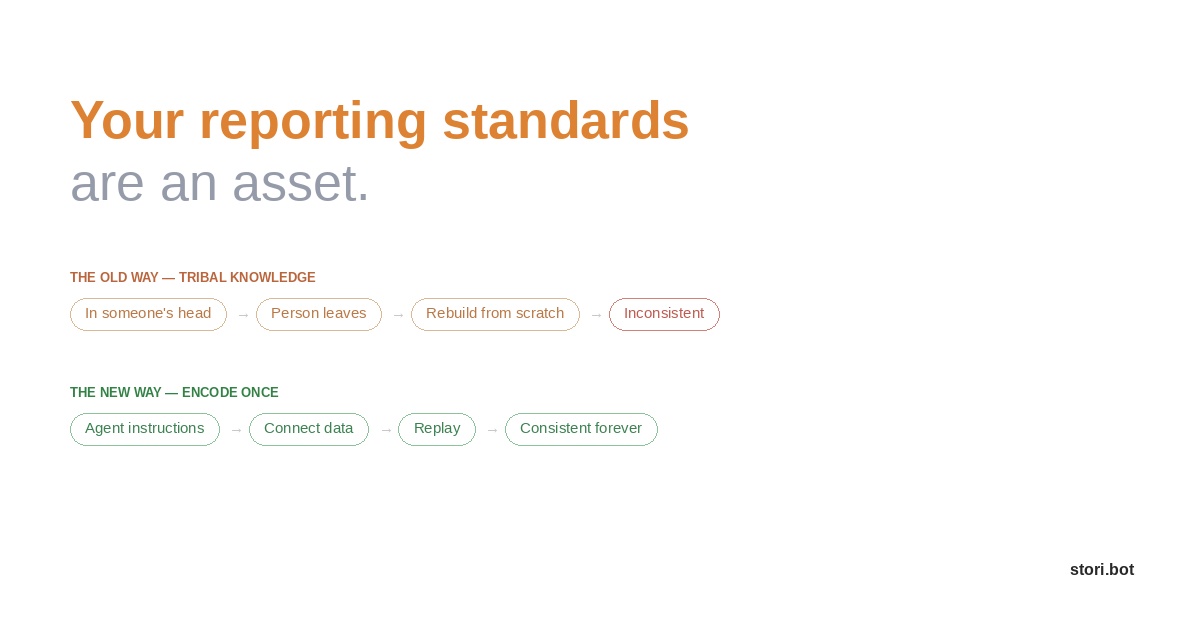
Every team has a way they report. It's rarely documented. Which metric leads, what gets flagged, how the numbers should look, even the colour palette — it's all wisdom passed down through corporate lore.
Without the person who built the report, every new replication is based on assumption. This isn't a process.
The knowledge that walks out the door
Your marketing lead has been building the same monthly performance report for ages. They know the CEO wants revenue first, channel breakdown second, and any overshoot highlighted in red.
They know the board version needs a YoY comparison but the team version doesn't. They know "active users" means DAU, not MAU — because of a conversation in a meeting room several months ago. None of this was written down.
Then, they decide to take a sabbatical. The person tasked with picking up the reporting gets a five-minute handover — a quick chat, a copy of the spreadsheet, and a "you'll be fine."
The new report is technically correct. The data is right, the charts render. But it somehow doesn't land. The CEO asks why the format changed. The board flags a metric that was always excluded. The weekly review runs 30 minutes longer than usual. Questions are being asked left right and centre. Questions that the previous report would have pre-empted.
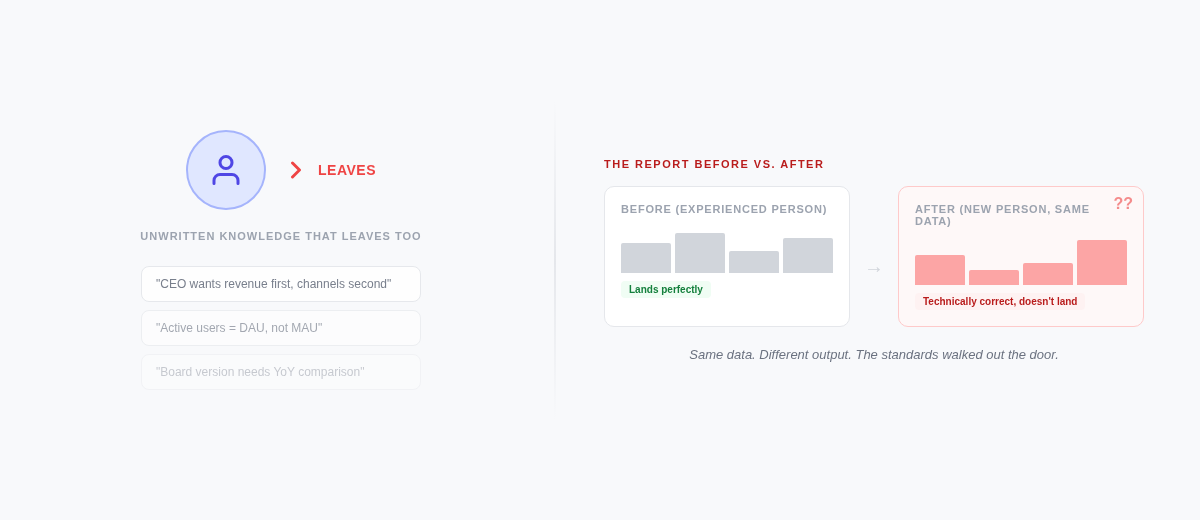
But what happened? The data didn't change...
Standards aren't just formatting preferences
The data may not have changed, but the standards did. It's tempting to dismiss this as a formatting problem. Just write a style guide, right? But reporting standards go deeper than font choices and colour palettes.
Standards include what to show and what to leave out. Which metrics need context — comparisons, benchmarks, targets — and which can stand alone. What order the narrative follows, and how bad data gets handled — flagged with a recommendation, or presented neutrally for the reader to interpret.
At their core, these are editorial decisions. They encode your organisation's understanding of what matters and how to communicate it. A CFO who's been refining their board reporting for three years has built something valuable — a distilled, opinionated view of how this company should present financial performance. It just happens to live in someone's head.
Your data changes every period. Your reporting logic shouldn't. The structure, the emphasis, the narrative arc — those represent accumulated judgement. They're an asset. And right now, for most teams, they're completely unprotected.
What "encoding" actually looks like and how to do it
It means writing your standards in a format a system can execute independently. Turning "the CEO likes revenue first" into a configuration that survives personnel changes.
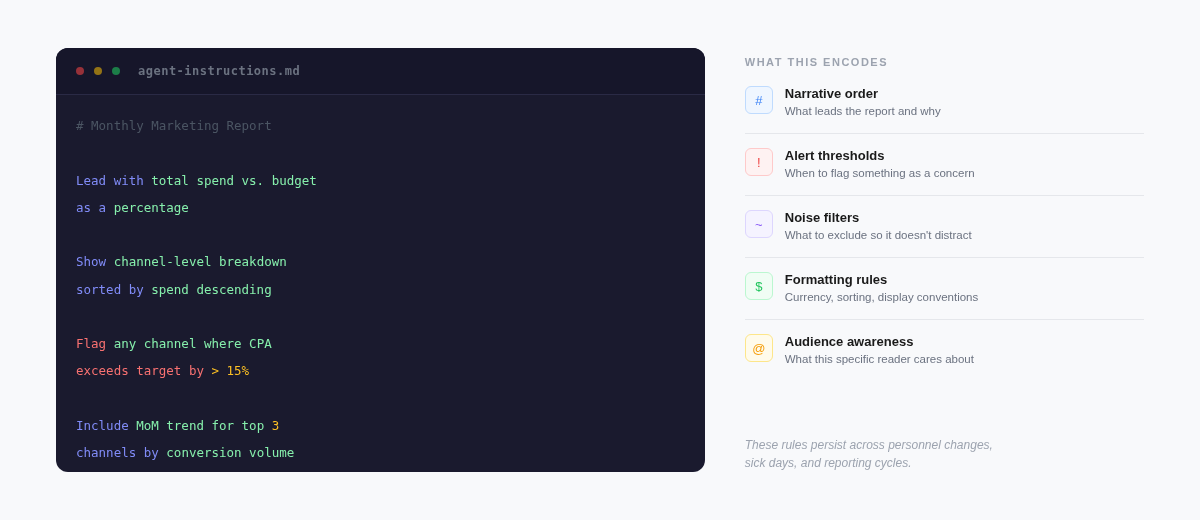
In StoriBot, this looks like agent instructions — plain-language directives that tell the system how to interpret data, what to build, and how to present it. Here's a simplified example for a monthly marketing report:
"Lead with total spend vs. budget as a percentage. Show channel-level breakdown sorted by spend descending. Flag any channel where CPA exceeds target by more than 15%. Include a month-over-month trend for the top three channels by conversion volume. Use Australian dollar formatting. Exclude display channels with less than $500 spend — they're noise."
That's not a prompt. That's a reporting standard. It encodes the same judgement your marketing lead carried in their head — which metrics matter, what thresholds trigger a flag, what noise to filter, how to format the output.
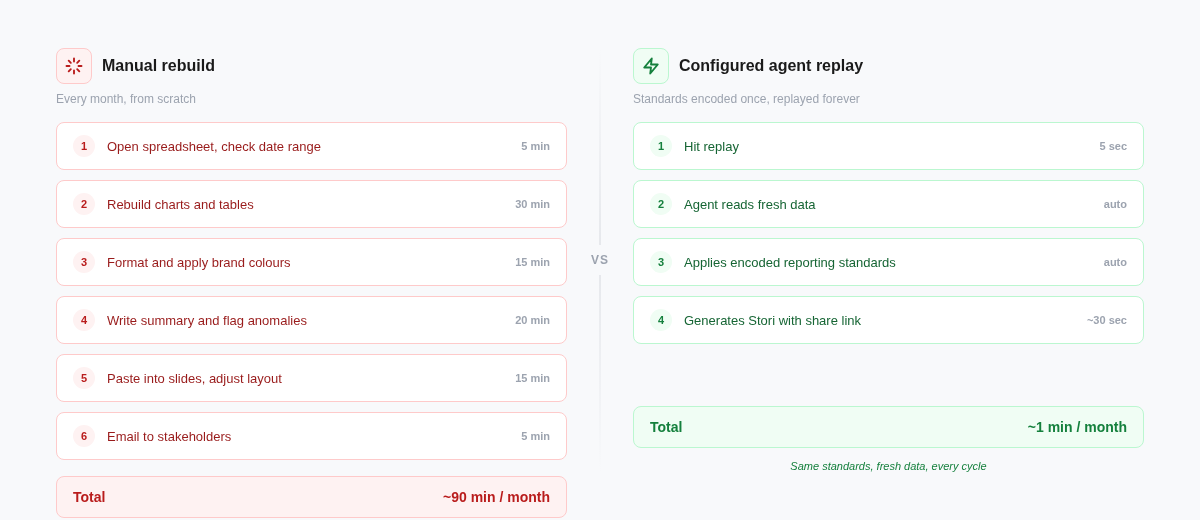
The difference is that it persists. When the data changes next month, the agent replays against the same standards and produces a consistent result.
The compound value of encoded standards
Once your reporting standards exist as a configuration, they begin to compound.
They improve over time. When someone says "can we add a section on retention?" or "flag anything below 70% completion rate," that feedback gets encoded into the agent instructions. The report gets better with each iteration, and the improvements persist. Six months of refinements stay baked in — they don't vanish when someone changes roles.
They become auditable. You can look at the agent instructions and see exactly what logic produced a given report. No guessing about which Excel formula was used, or whether the pivot table is pulling from the right tab. The reasoning is in the configuration, not buried in a spreadsheet.
Why most teams haven't done this yet
If this is so valuable, why isn't everyone doing it?
Until recently, there wasn't a practical way to. BI tools let you save dashboard configurations, but those are structural — which chart goes where, which data source connects to which panel. They don't capture the editorial layer: what to emphasise, what to flag, what narrative to follow.
Templates get you halfway there, but they're rigid. A template says "put a bar chart here." It doesn't say "if paid search CPA is up more than 15%, lead with that finding and add context about seasonality." Templates handle layout. They don't handle judgement.
What's changed is that agents can interpret plain-language instructions and apply them to data — consistently, every time. You describe what "good reporting" looks like for your team, and the agent executes it. No query language. No complex BI workflow.
Reporting standards used to be inexpressible — too nuanced for a template, too detailed for a style guide. Now they're configurable.
How to start
You don't need to encode everything at once. Start with the report that causes the most pain — the one someone spends hours rebuilding every month, the one that breaks whenever the usual person is unavailable.
Write down the rules. Not the data — the judgement. What leads? What gets compared to what? What's worth flagging? What does the audience care about that a generic chart won't capture?
Then put those rules into agent instructions. Connect your data source. Hit replay. See if the output matches what you'd normally build.
If it doesn't, refine the instructions. Every refinement makes the standard more precise and the output more consistent. After two or three cycles, you'll have a configured agent that produces a report indistinguishable from the one your best person builds manually — except it takes one click instead of two hours. It also frees that person up to focus on areas they may not have had the time to execute.
Your reporting logic is worth protecting
Most teams invest heavily in data infrastructure — warehousing, ETL pipelines, governance, quality monitoring. They treat the data as an asset.
But the reporting logic — the accumulated judgement about how to present, communicate, and contextualise that data — lives outside your technology.
Your reporting standards are an asset. They represent months or years of refinement about what your audience needs to see, in what format, with what context. Encode them, version them, replay them — don't reconstruct from scratch every time the numbers change.
Book a demo → · Connect Google Sheets and try it yourself →
Related reading: