Picture this. You've built the charts. The analysis is solid. Now you need 12 people to see it — the kicker? Half of them don't have access to the tool you used.
The sharing dilemma nobody talks about
BI tools are great at creating visualisations, but sharing them can open up a can of worms. From paying for more licences to that dreaded sign-up and access process.
Want to share a Looker dashboard with a client? That's a viewer licence. Power BI report for a board member? They need a Microsoft account and the right permissions. Tableau workbook for a cross-functional partner? Good luck with the IT ticket.
So teams default to the workarounds we all know too well. Screenshot the chart. Paste it into Slides. Export a PDF. Attach it to an email. The data that was live, interactive, and explorable five minutes ago is now a static image in someone's inbox.
The problem isn't creating the visualisation. It's getting it in front of the people who need to act on it — without handing them a login, a licence, or access to the underlying data.
Why existing approaches fall short
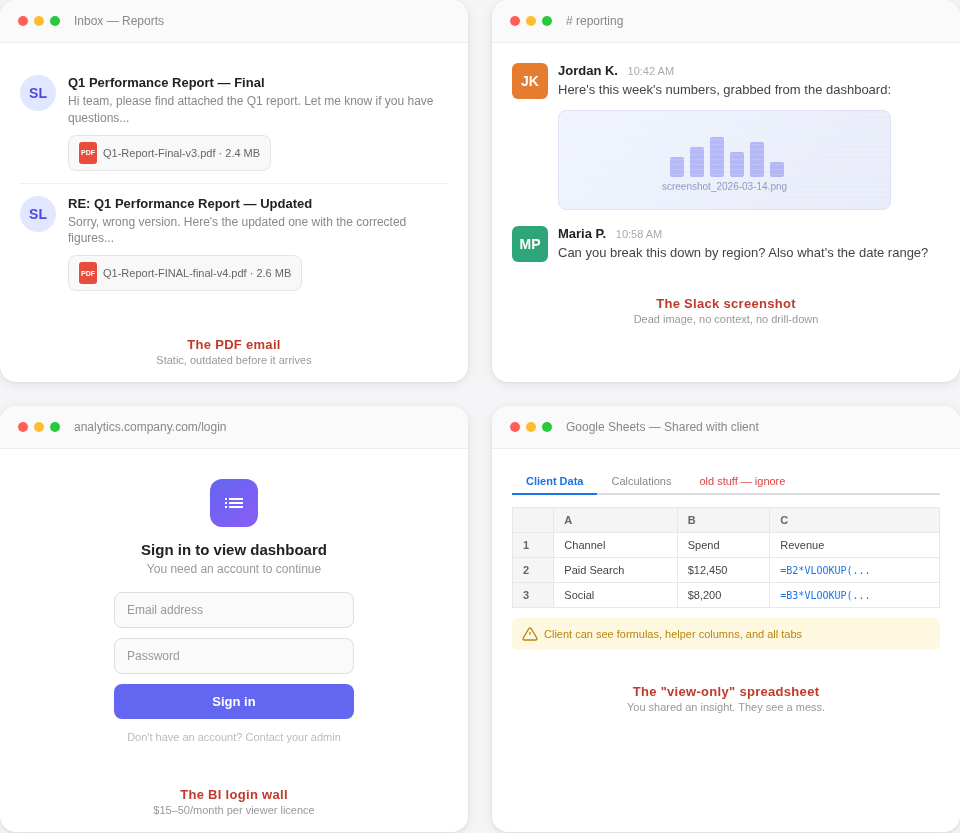
The PDF export. You lose interactivity. The recipient can't filter, drill down, or explore. If they have a follow-up question, they email you and wait. Meanwhile, the data has already changed.
The screenshot in Slack. Quick, but useless beyond the first glance. No context. No ability to check the numbers. No way to come back to it next week when the data matters again.
The "view-only" spreadsheet link. Now your client can see your raw data, your formulas, your helper columns, and that tab you forgot to delete called "old stuff — ignore." You wanted to share an insight. You shared a mess.
The viewer licence. Technically it works. Practically, you're paying $15–50/month per person who needs to glance at a chart once a week. For a 10-person client team, that's $150–500/month just so they can see their own data.
Each approach solves one problem while creating two more.
A different model: share a link, not a login
StoriBot takes a different approach to sharing. Instead of granting access to a tool, you generate a share link to a Stori — a series of interactive, full-screen data graphics built from your data.
The recipient clicks the link. They swipe through the graphics. They can explore the data, see the story you've built, and interact with the visualisations. No account creation. No software download. No training session.
Here's how it works in practice.
Step 1: Build the Stori from your data
Connect your data source and describe what the visualisation should communicate:
"Create a quarterly performance overview for our client. Show revenue vs. target by month, break down by product category, and highlight any categories trending below 90% of target."
The agent reasons through your data and builds a series of interactive graphics — charts, infographics, animated data sequences — each designed to land a single insight. You swipe through them like a story.
If you've already built a Stori (maybe following the steps in our Google Sheets to client report guide), skip straight to step 2.
Step 2: Generate a share link
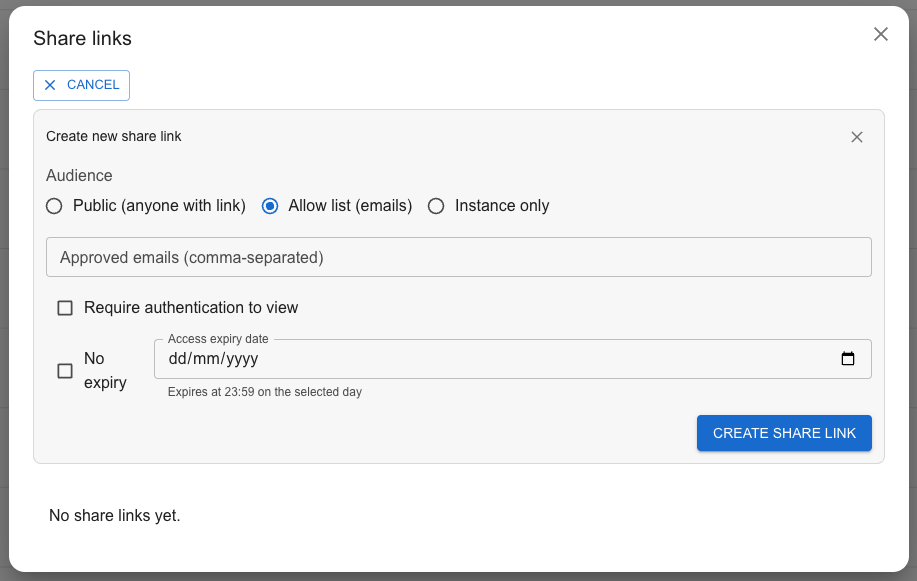
Once your Stori looks right, generate a share link. You choose the access level:
- Public: Anyone with the link can view it. Good for published reports, marketing dashboards, or anything meant for a broad audience.
- Allow-list: Only specific email addresses can access it. The viewer verifies their email — no password, no account creation. Good for client reporting where you want to control exactly who sees the data.
- Authenticated: Viewers sign in with their existing identity provider. Good for internal teams where you want an audit trail.
Each option can be set to expire after a specific date or stay active indefinitely.
Why it matters: You decide who sees what, and for how long. The recipient doesn't need to learn a new tool or ask IT for access.
Step 3: Your recipient opens the link
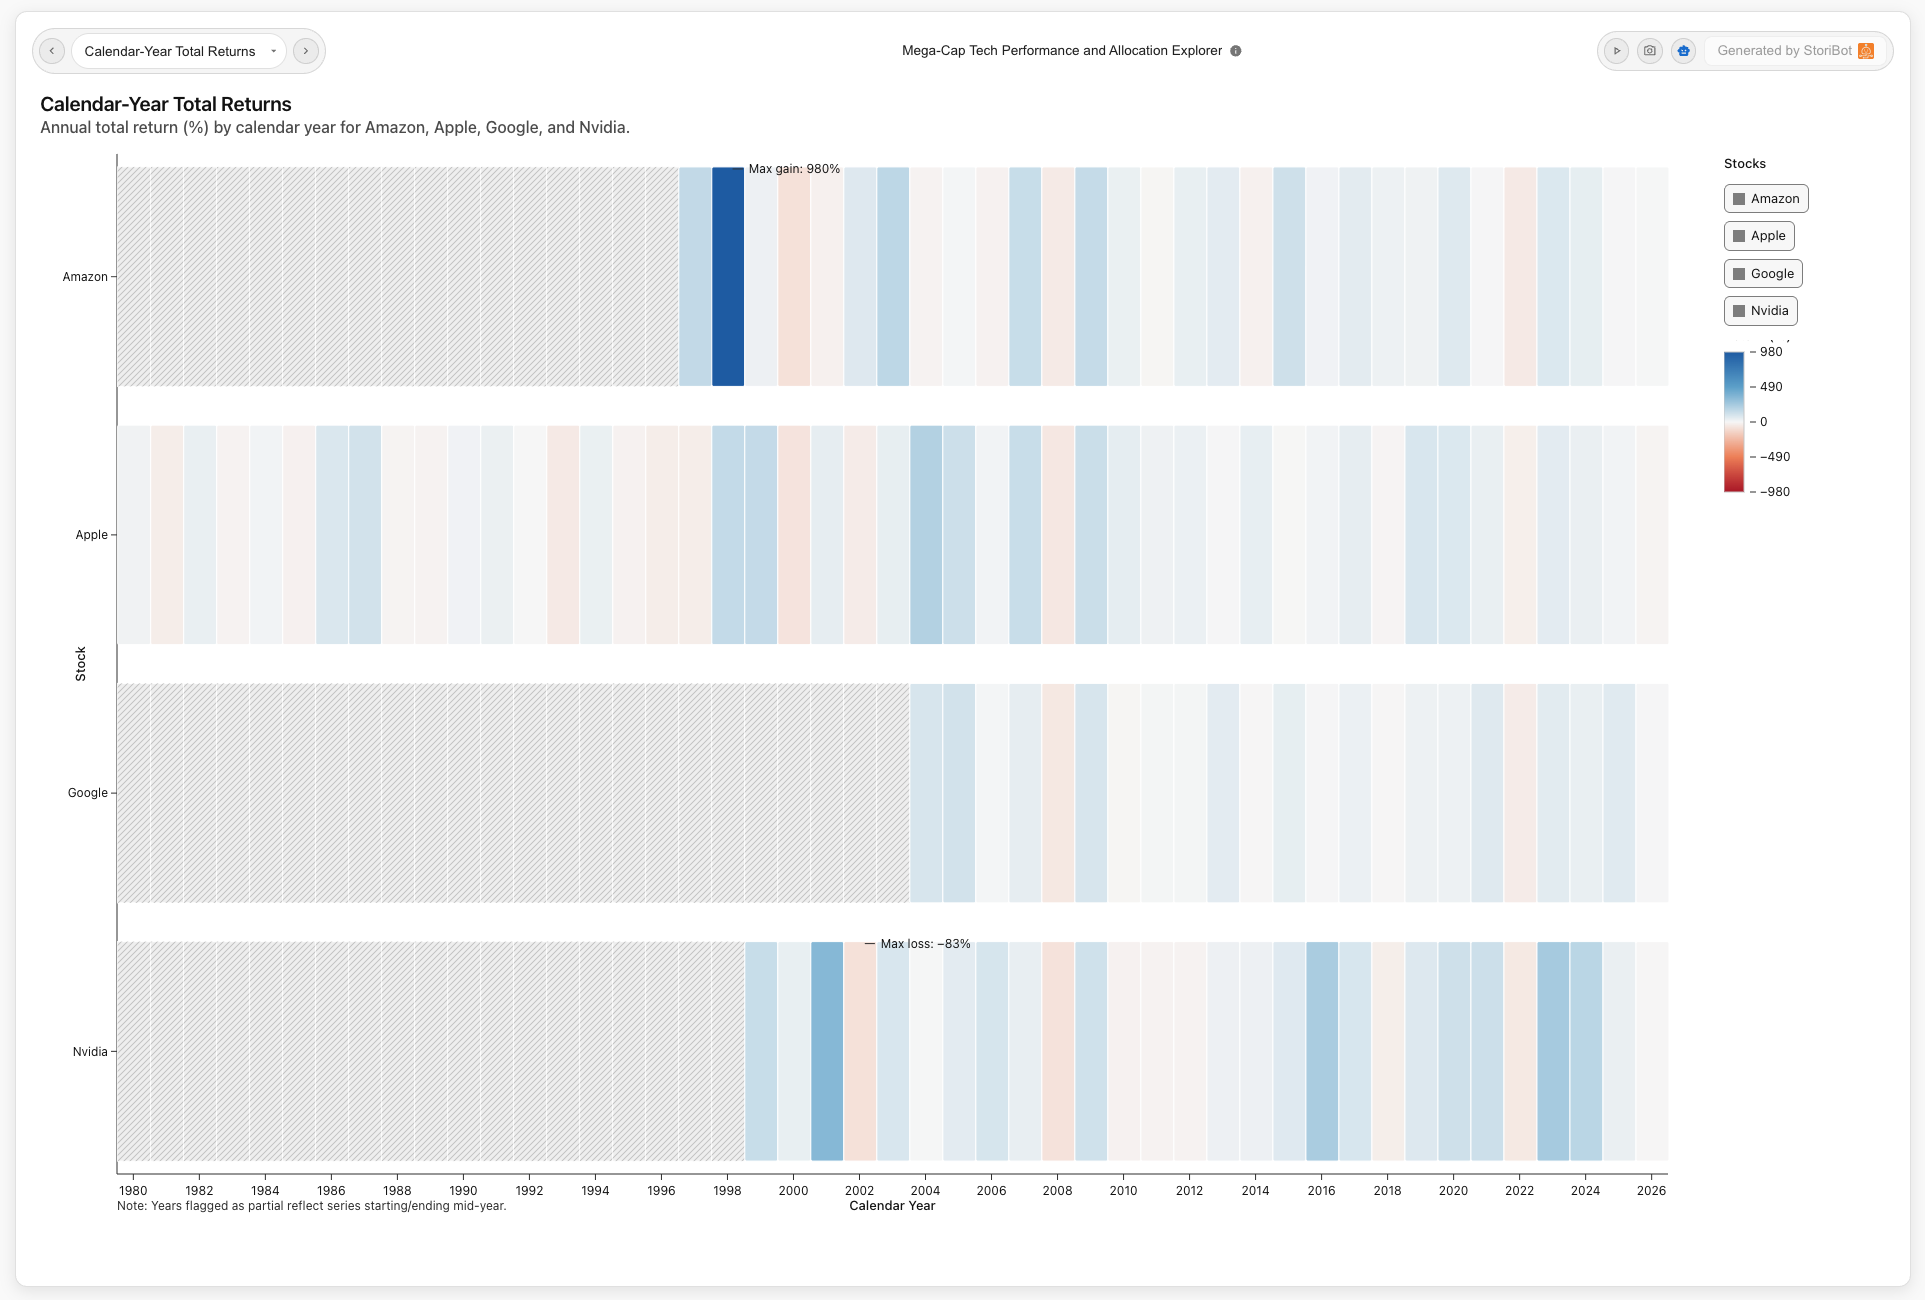
This is what the viewer experience actually looks like: full-screen, interactive data graphics they can swipe through at their own pace. No sidebar navigation. No query builder. No "click here to add a filter" confusion.
Each graphic is designed to communicate one thing clearly. Revenue trend. Category breakdown. Flagged items. The recipient reads the Stori the way you intended — in sequence, with context.
They can interact with individual graphics to explore the data further, but they can't edit the source, see your raw data / spreadsheet, or break anything.
Why it matters: You're sharing a curated view of the data, not raw access to a tool. The recipient gets the insight without the complexity.
Step 4: Manage access over time
Need to revoke access after a project ends? Turn off the share link. Need to add a new stakeholder? Add their email to the allow-list. Need to check who's viewed the Stori? The access log shows you.
You can also create multiple share links for the same Stori with different access levels — one public link for the team, one allow-listed link for the client, each with its own expiry.
Why it matters: Sharing isn't a one-time action. Projects evolve, teams change, and client relationships end. You stay in control without managing seats or licences.
Step 5: Replay and reshare
When the data updates — new month, new quarter, new campaign results — hit "Replay." The agent re-runs against the latest data in your Sheet and produces a fresh Stori. Generate a new share link and send it to the same recipients. They get the updated insights without needing to log in or learn anything new.
Why it matters: Sharing isn't just about the first send. It's about keeping people informed as data changes, without adding to your workload.
When this approach works best
Client reporting. Your client doesn't want a BI login. They want to see how their campaign performed, explore the numbers, and forward the link to their boss. A share link does exactly that.
Board and investor updates. Board members check reports quarterly at most. A per-seat licence for four views a year makes no sense. A share link with an expiry date does.
Cross-functional collaboration. The marketing team needs to see the sales pipeline. The ops team needs to see customer health scores. None of them need access to your data warehouse. They need a curated view they can open in a browser.
External stakeholders. Partners, vendors, regulators — anyone outside your organisation who needs to see specific data without seeing everything else.
The maths on viewer licences
A quick comparison. Say you have 20 people who need to see a weekly dashboard:
With a traditional BI tool, that's 20 viewer licences at $15–50/month each. That's $300–1,000/month — $3,600–12,000/year — for people to look at charts.
With a share link, it's one Stori, one link, 20 viewers. The cost doesn't scale with the number of eyeballs. The people who create the analysis pay for the tool. The people who consume it just click a link.
Try it with your own data
Connect a Google Sheet and share your first Stori in under five minutes. No viewer licences. No IT tickets. No PDFs.
Related reading:
- How to turn a Google Sheet into a client-facing report
- How to create an interactive dashboard from Google Sheets (without Looker)
- How to automate weekly reports from Google Sheets (coming soon)