StoriBot works best when you treat it like a collaborator. In this blog, we walk you through how to get the most out of StoriBot — taking you from your first prompt to a polished, shareable Stori.
Be specific or ask for direction — both work
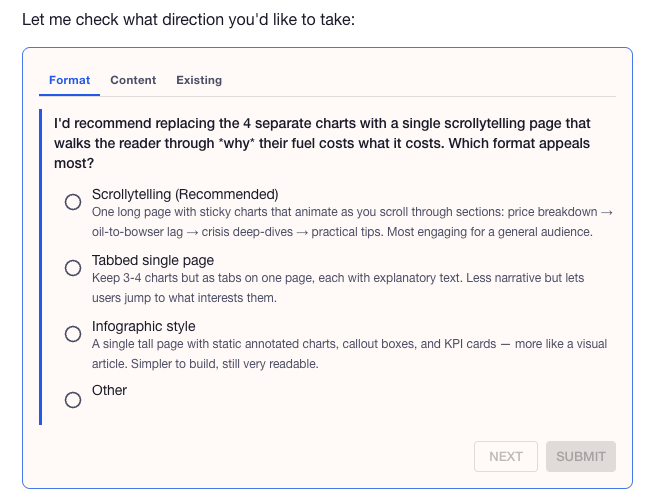
StoriBot handles both extremes well. It works best when you either tell it exactly what you want, or step back and let it find the story in your data and have it make suggestions. StoriBot can both take directions well and ask you clarifying questions to get to to a good output for you.
Ask for direction
"Show me what's interesting in this data."
"What are some insights we can draw from this month's production report?"
StoriBot analyses the data set you've provided and surfaces connections you might not have spotted. StoriBot can ask you questions to clarify what your looking for as an output use this to get better outputs.
Specific examples
If your familiar with the data set or have a specific need in mind then just ask for that.
"Build a grouped bar chart comparing Q1 vs Q2 revenue by product line, with a target line at $200k."
"Create a scatter plot of customer acquisition cost vs lifetime value, coloured by channel."
StoriBot builds exactly what you asked for, suggests improvements along the way, and delivers when you're happy.
Tell it about your audience
One neat trick to get a little more out of StoriBot is to tell it about the audience for your Stori or the way the Stori might be used. This additional detail can really open up StoriBot's ability to guide you towards something that will resonate with your audience.
Editing is built in, not an afterthought
Once a Stori exists, you're not locked in. Everything can be edited. When you edit with Stori, the editing is as conversational as creating.
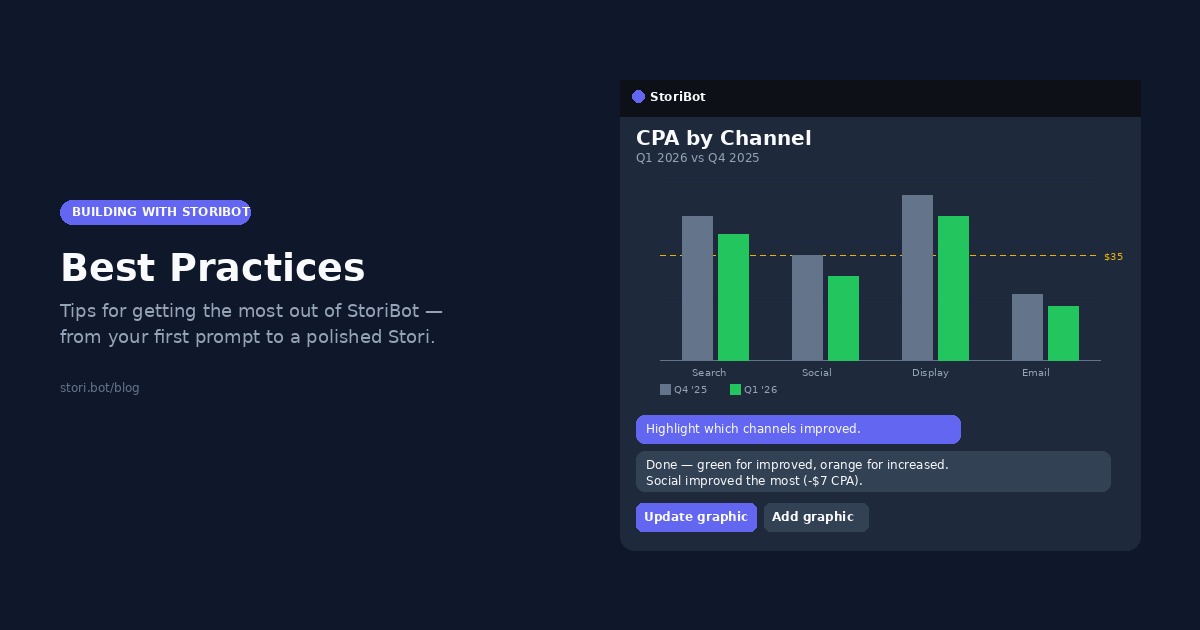
Want to change a specific graphic? Reference it directly, you can type the "@" symbol and see the name of every chart or page in your Stori and give more specific direction to StoriBot:
"In
@December Sales 2025, swap the axes so regions are on the y-axis."
"Change the title of
@Q1 Performanceto 'Q1 Performance by Channel.'"
Want to rearrange things? Just say so:
"Move the summary chart to the top."
"Delete the pie chart — replace it with a horizontal bar chart showing the same data."
StoriBot remembers the full context of your session. It knows what each graphic contains, how they relate, and what you've already discussed. Editing feels like continuing a conversation, not starting over.
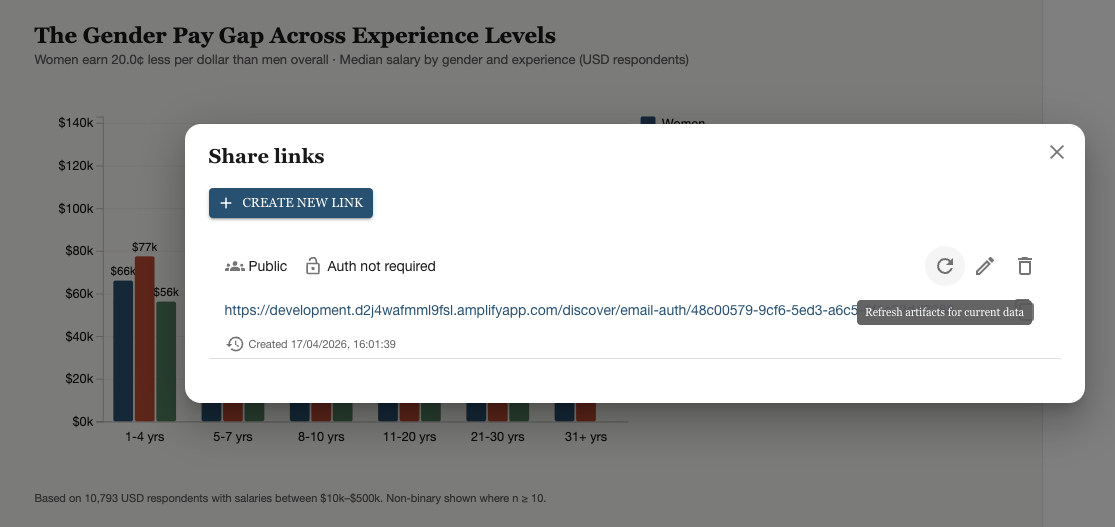
Edits can be pushed to shared Stories instantly
We've all been there, you've pulled something together for a client and shared it, not 10 minutes later you notice a small error. With StoriBot this is not a panic stations moment. Simply open the Stori, fix the error and refresh the link. That's it, the client might not even notice. The orignal share links can be updated for minor or major changes. Makes it easy for your stakehodler and for you.
Go beyond bar charts
The default bar chart is a safe option, but it's rarely the most interesting one. StoriBot can build a wide range of formats — and the right choice often depends on what you're trying to say, not what the data looks like.
A few less-obvious formats worth experimenting with:
- Infographics that pair a headline number with a supporting visual — great for exec summaries or social-ready Storis.
- Maps when your data has a geographic dimension, like state-by-state revenue, store locations, or regional performance.
- Scrollytelling Storis that reveal insights one step at a time — useful for client walkthroughs or onboarding decks where you want the reader to follow a narrative.
- Small multiples — a grid of tiny charts, one per category — for quick pattern-spotting across many segments at once.
Just ask for what you want:
"Show this as a map of Australia, coloured by revenue per state."
"Turn this into an infographic with the headline number on top and three supporting stats underneath."
"Break chart 2 into small multiples — one mini-chart per product line."
If you are new to data graphics or are not sure what might be a good chart for your data just ask StoriBot for ideas.

Global vs local: theme the Stori, edit the chart
There's a useful distinction between global changes (that affect the whole Stori) and local edits (that affect just one graphic). Knowing which scope you're working in saves a lot of back-and-forth.
Global changes — the whole Stori:
"Switch the whole Stori to a dark theme."
"Use the client's brand colours navy #1E3A8A and orange #F97316 on all graphics."
"Make every chart title sentence case."
Local edits — a single graphic:
"In
@Q1 Sales by Region, change just the bar colour to red."
"Override the font size on the headline number in
@Year on Year Comparison— make it larger."
"Remove the gridlines from the line chart."
StoriBot follows whichever scope you imply. If you're ever unsure, just name it directly — "globally" or use the @mention tool to specific which chart or page you're referring to. This is especially handy when a client has strict brand guidelines but you still want to highlight one specific chart with a standout colour.
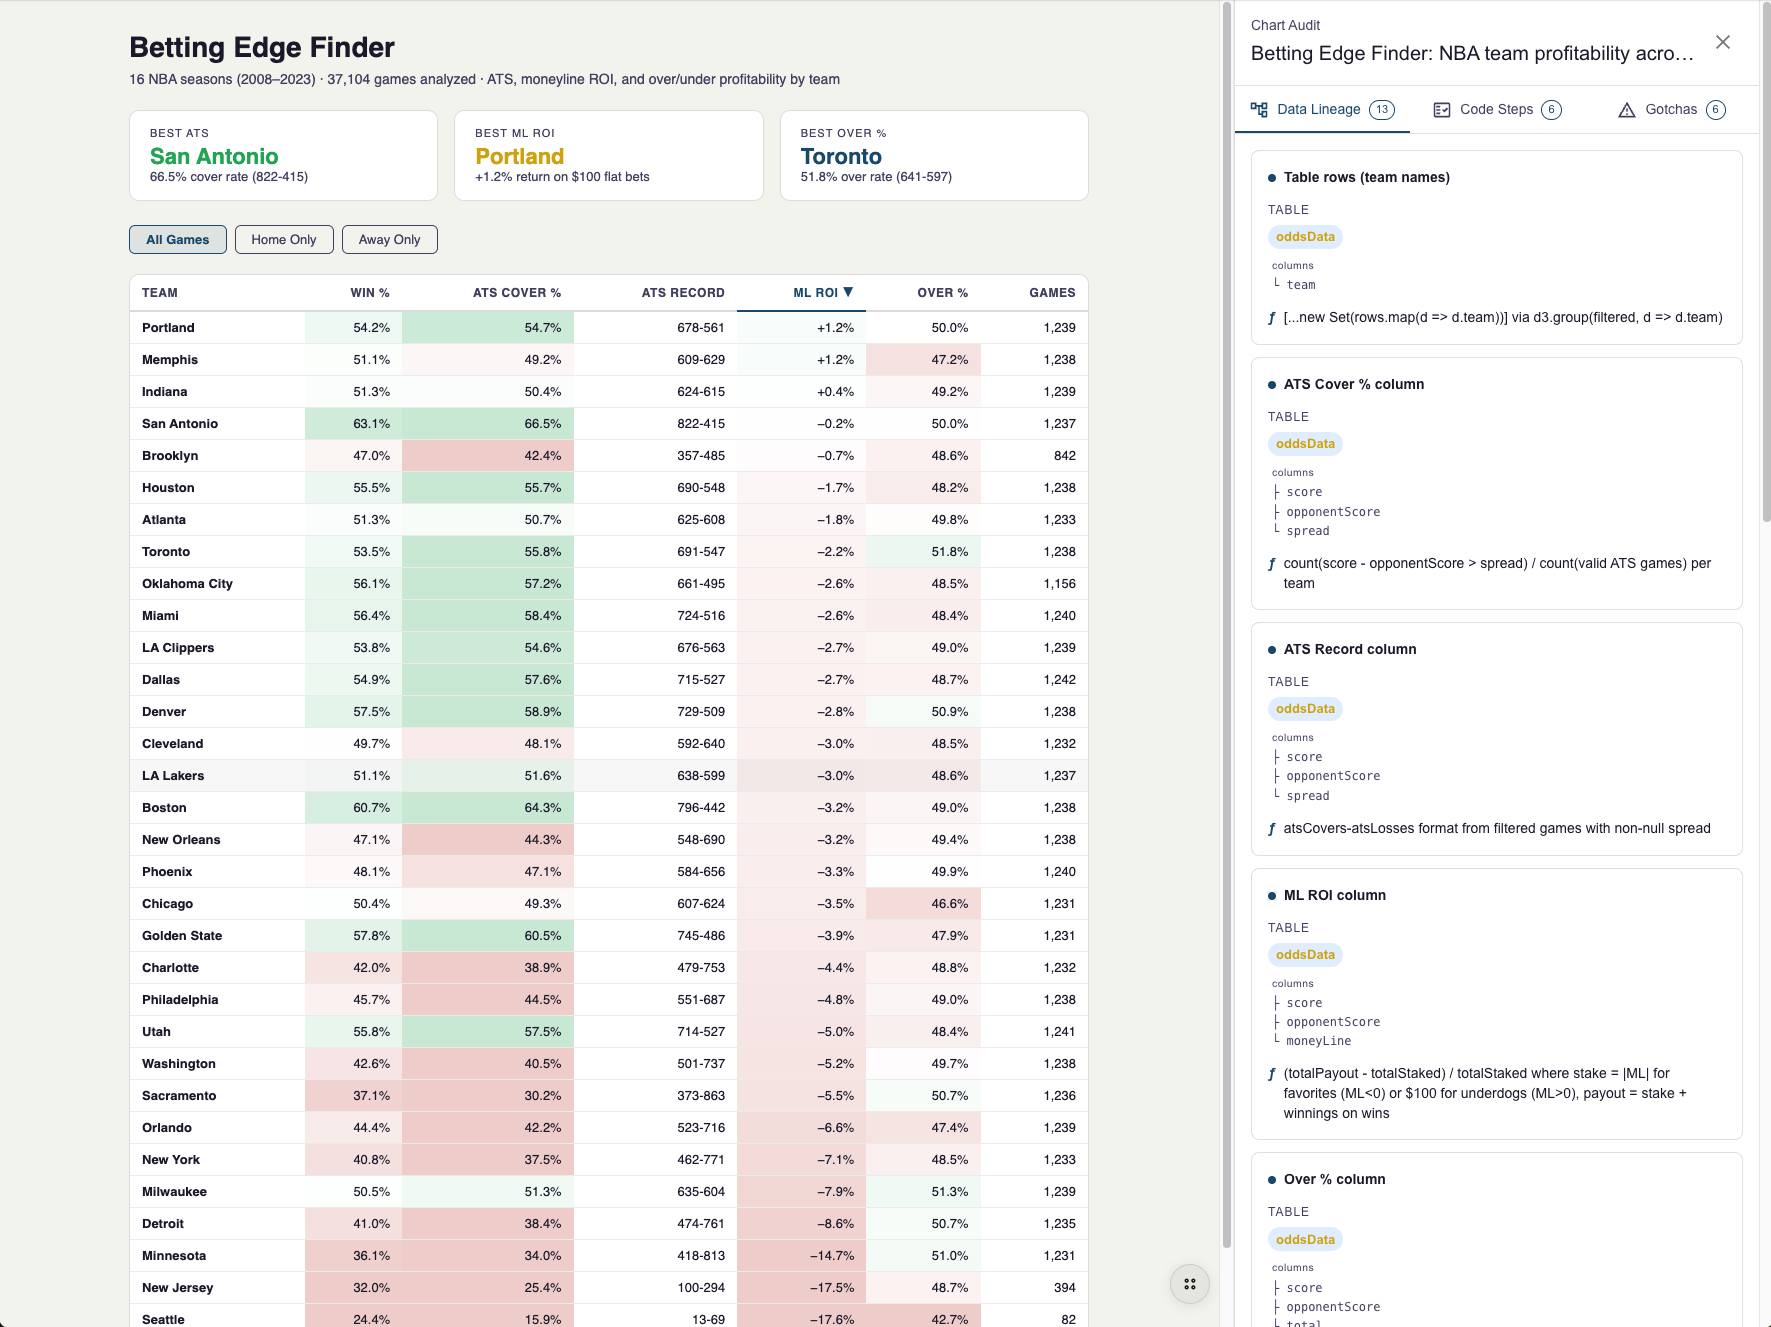
Trust the computation audit trail
Every number in a Stori has a trail back to your source data. When StoriBot calculates a percentage change, aggregates by category, or derives a trend, it records exactly what it did and what formula it used.
Why does this matter? Because when your client asks "where did this 23% figure come from?" you have an answer. It's not a black box. You can inspect the calculation, verify it against your source data, and explain it with confidence.
This matters most when you need your numbers to be right — and defensible. Your client isn't just trusting a graphic. They're trusting the maths behind it too.
You can ask StoriBot to show you the audit trail at any point:
"How did you calculate the growth rate in chart 2?"
"Show me the formula used for the year-over-year comparison."
It'll walk you through every step.
Try these patterns with your own data
The people who get the best results aren't the ones who write the longest prompts. They're the ones who have a conversation. Start, iterate fast, and let StoriBot handle the polish.
Connect a Google Sheet and put these practices to work. See our previous blogs for how to connect your Google Sheets.
Connect Google Sheets → · See example Stories →
More in this series:
- New to StoriBot? Start with Building with StoriBot: how to use it
- Want to understand why it works? Read Building with StoriBot: what's under the hood
Related reading: